Every event.
Every metric.
One report away.
Reports is the platform's analytical core — 60 pre-built reports across 14 categories, a full-text event search engine covering every record ever created, and a custom report builder for anything the standard library doesn't already cover.
Reports at a glance
One panel covering every dataset the platform generates — from a single event to platform-wide executive metrics.
The Reports panel is the single destination for turning raw platform activity — events, responders, communities, patrols, cameras, access control, WhatsApp intelligence — into something a manager, a client, or a regulator can actually read.
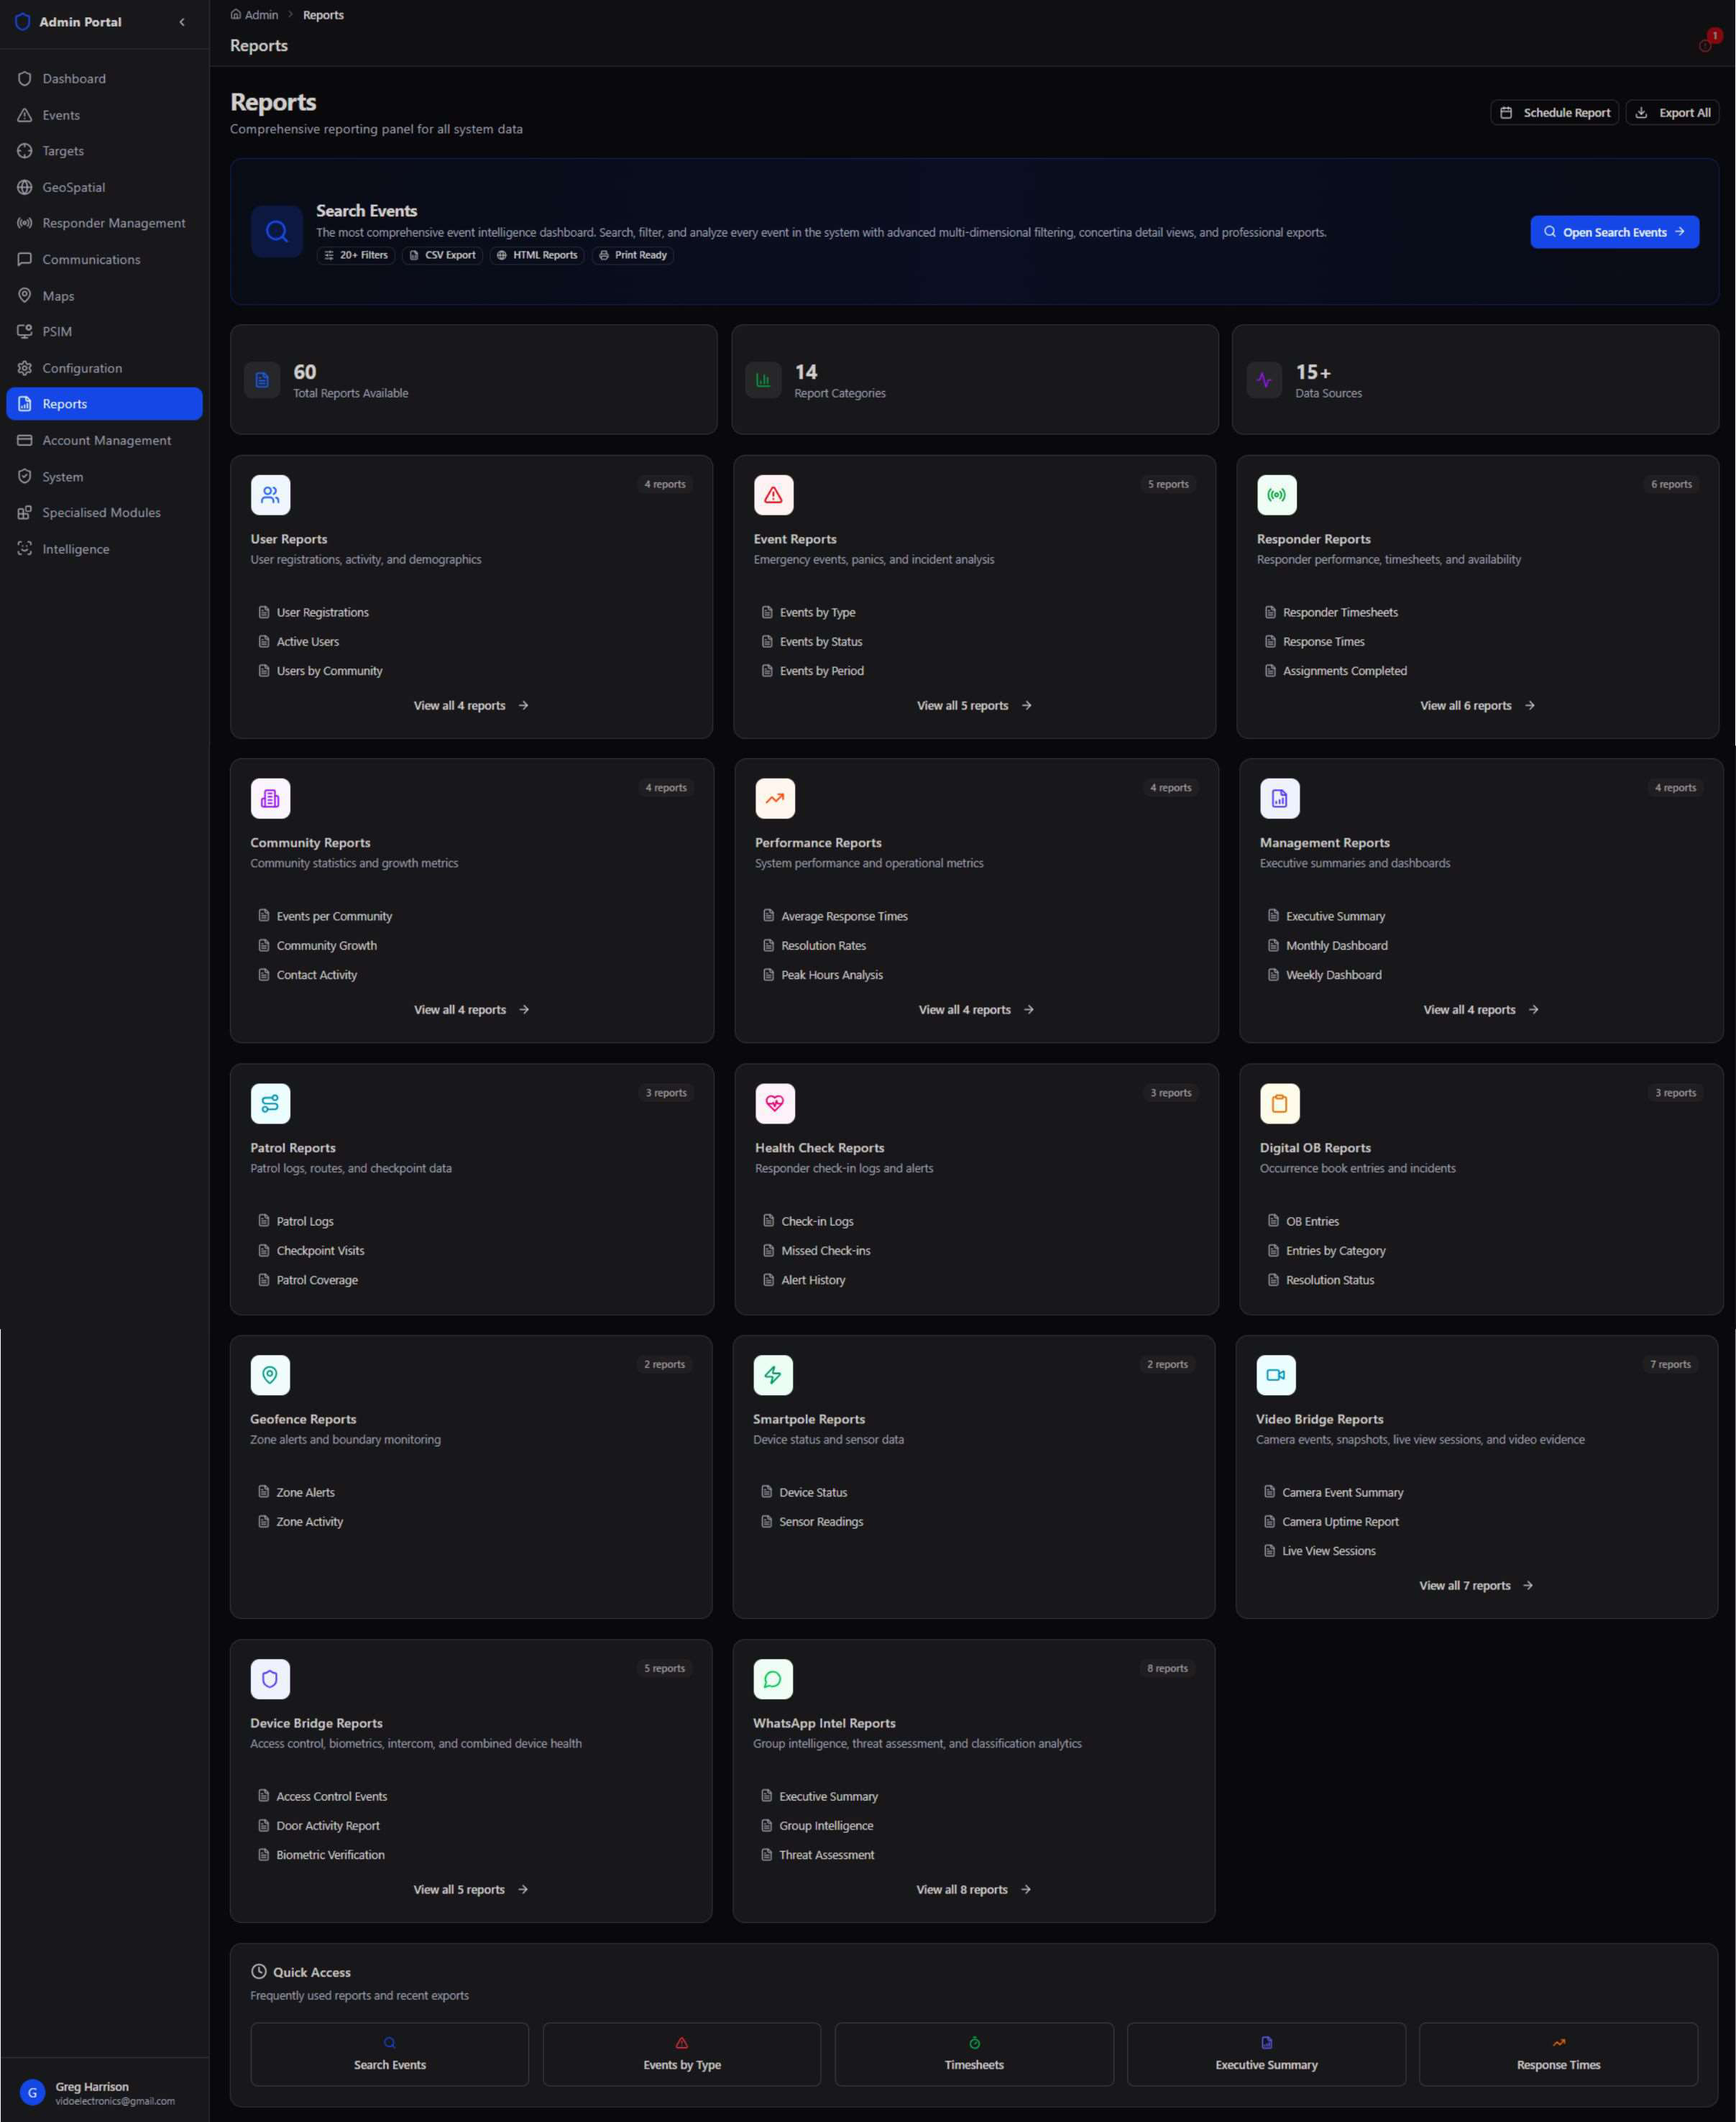
Every category card shows its report count up front and expands to a full list — from 2 reports (Geofence, Smartpole) to 8 (WhatsApp Intel). A Quick Access strip at the bottom surfaces the five most frequently used reports — Search Events, Events by Type, Timesheets, Executive Summary, and Response Times — for one-click access without hunting through categories.
Two ways in. Jump straight to Search Events for a single event or a filtered list, or open any category card for pre-aggregated metrics, charts, and trends already built for that dataset.
Search Events
The platform's most comprehensive event intelligence dashboard — every event, every source, every field, searchable and exportable.
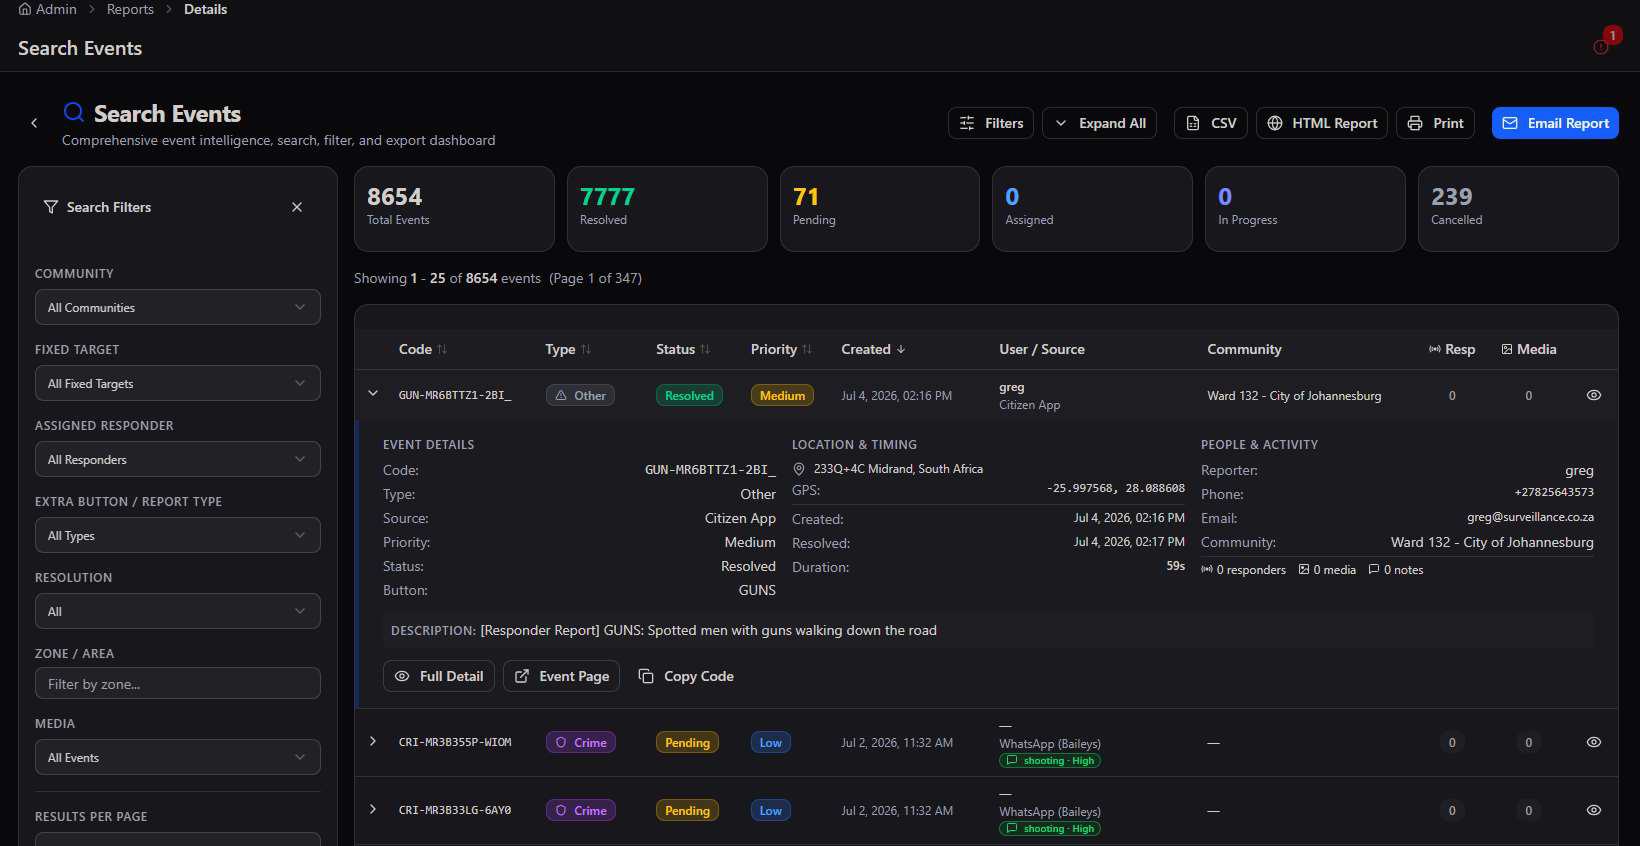
Search Events is the flagship report: a live, filterable table over the platform's entire event history, with 20+ filters, inline expand-to-detail rows, and a full concertina-style detail view for any single event.
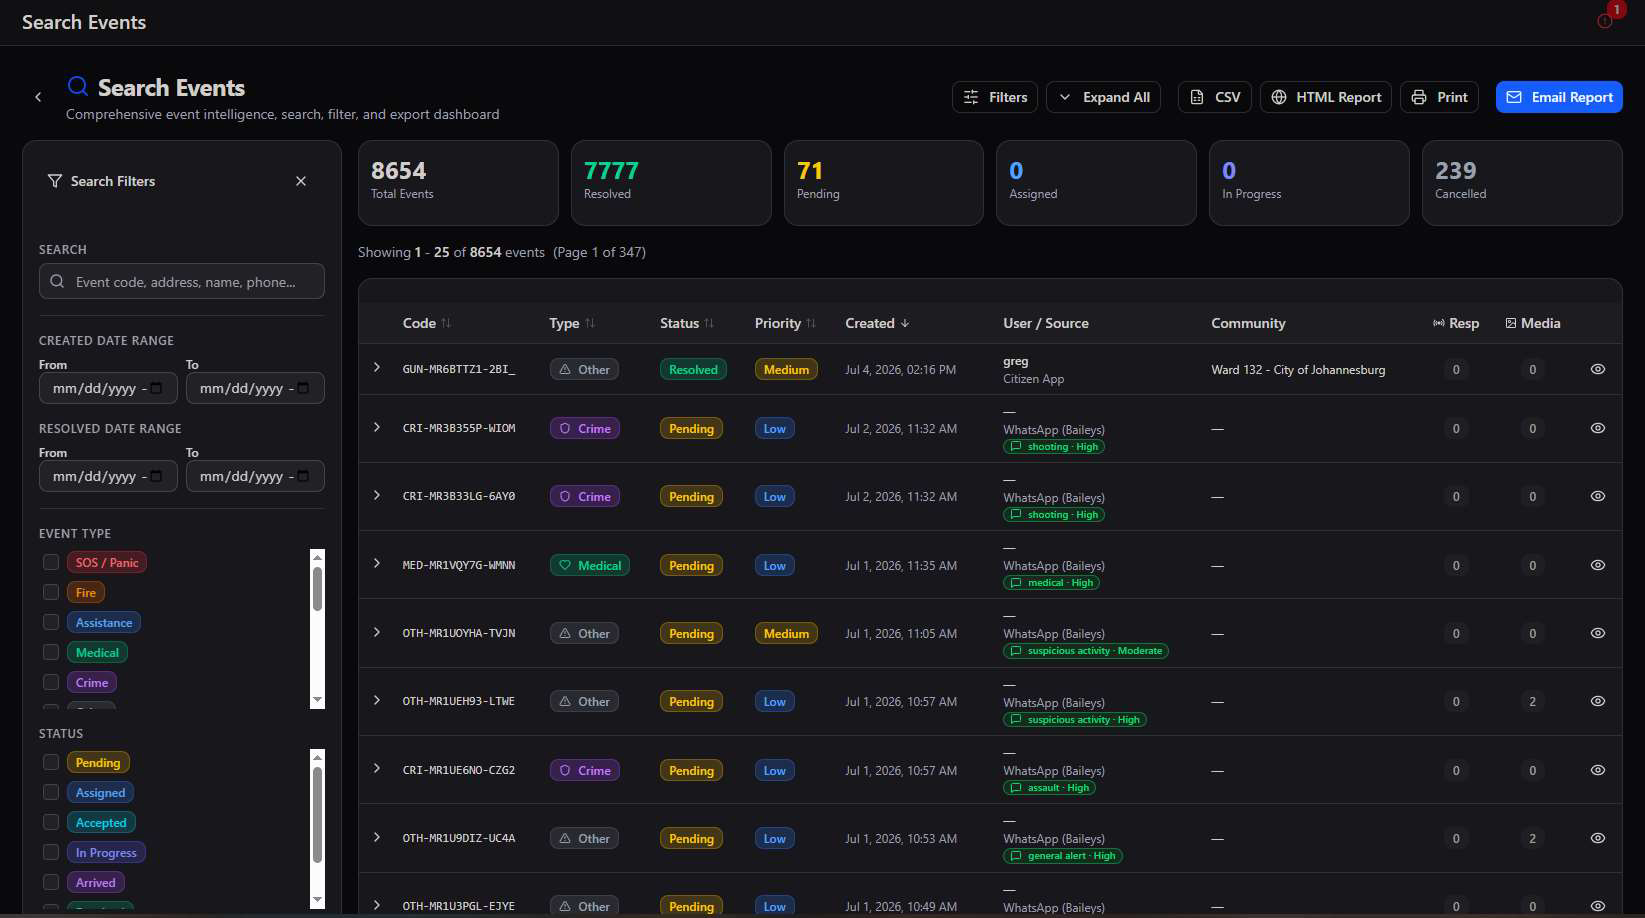
20+ filters across every dimension
The Search Filters panel narrows the full event history by date, type, status, priority, source, completion method, community, target, responder, report type, resolution, zone, and media presence — any combination at once.
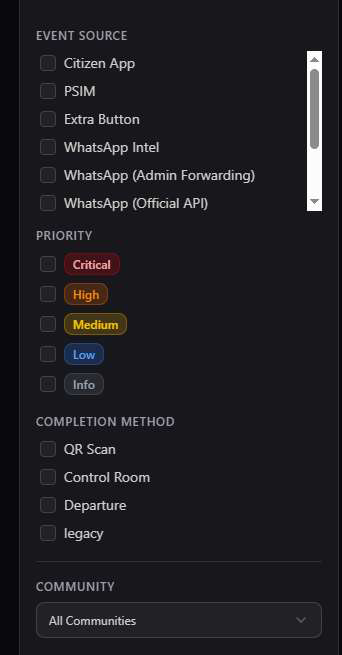
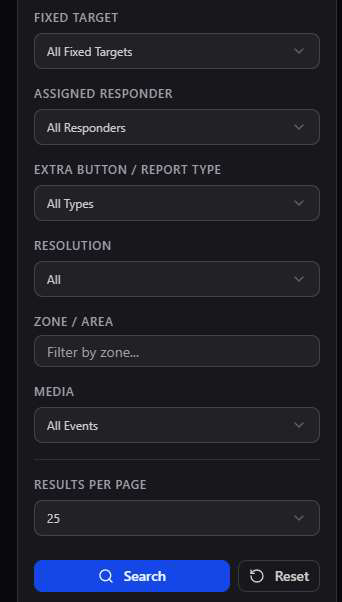
Expand any row to a full concertina detail
Clicking the caret on any result expands it in place — Event Details, Location & Timing, and People & Activity side by side — with quick actions to open the Full Detail panel, jump to the Event Page, or Copy Code.
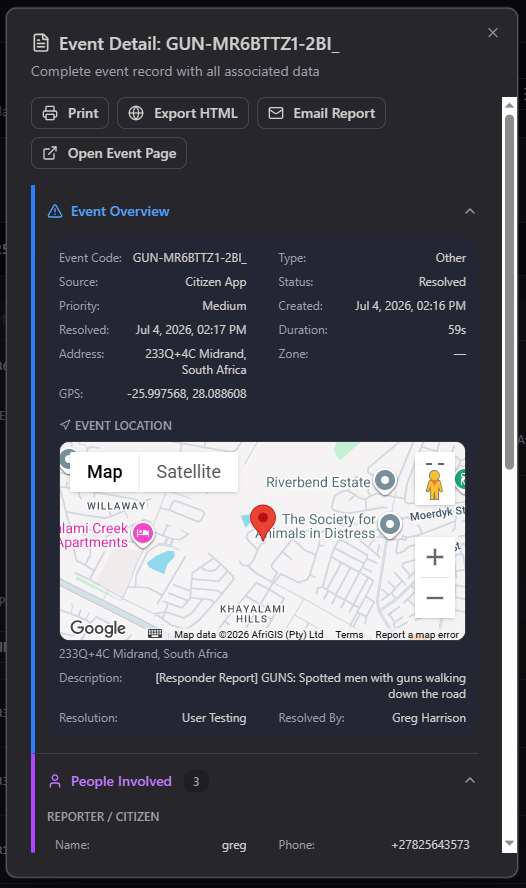
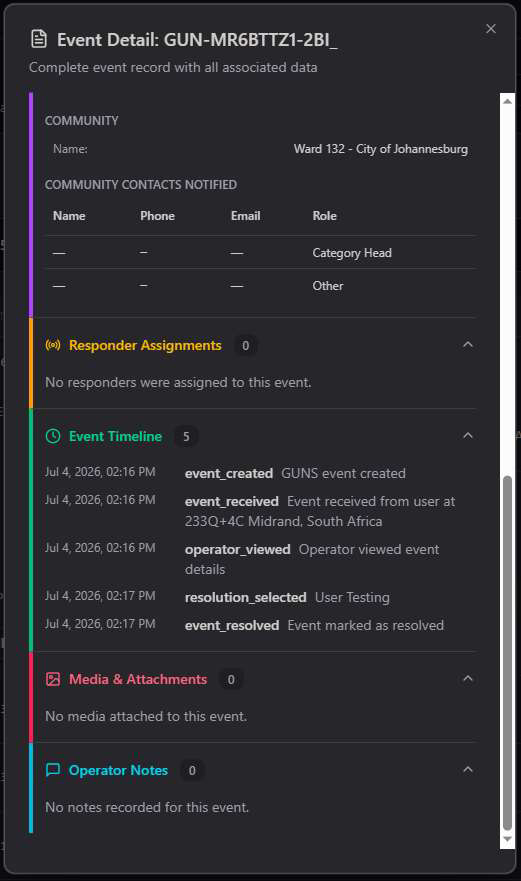
A complete audit trail. The Event Timeline logs every state change — event_created, event_received, operator_viewed, resolution_selected, event_resolved — with a timestamp for each, giving a defensible record for every event handled on the platform.
Export, Print & Distribution
Every report — from a single event to the full search result set — leaves the platform in whatever format the recipient needs.
Reports aren't locked inside the dashboard. Any report or filtered result set can be exported, printed, or pushed directly to a recipient, from a single button.
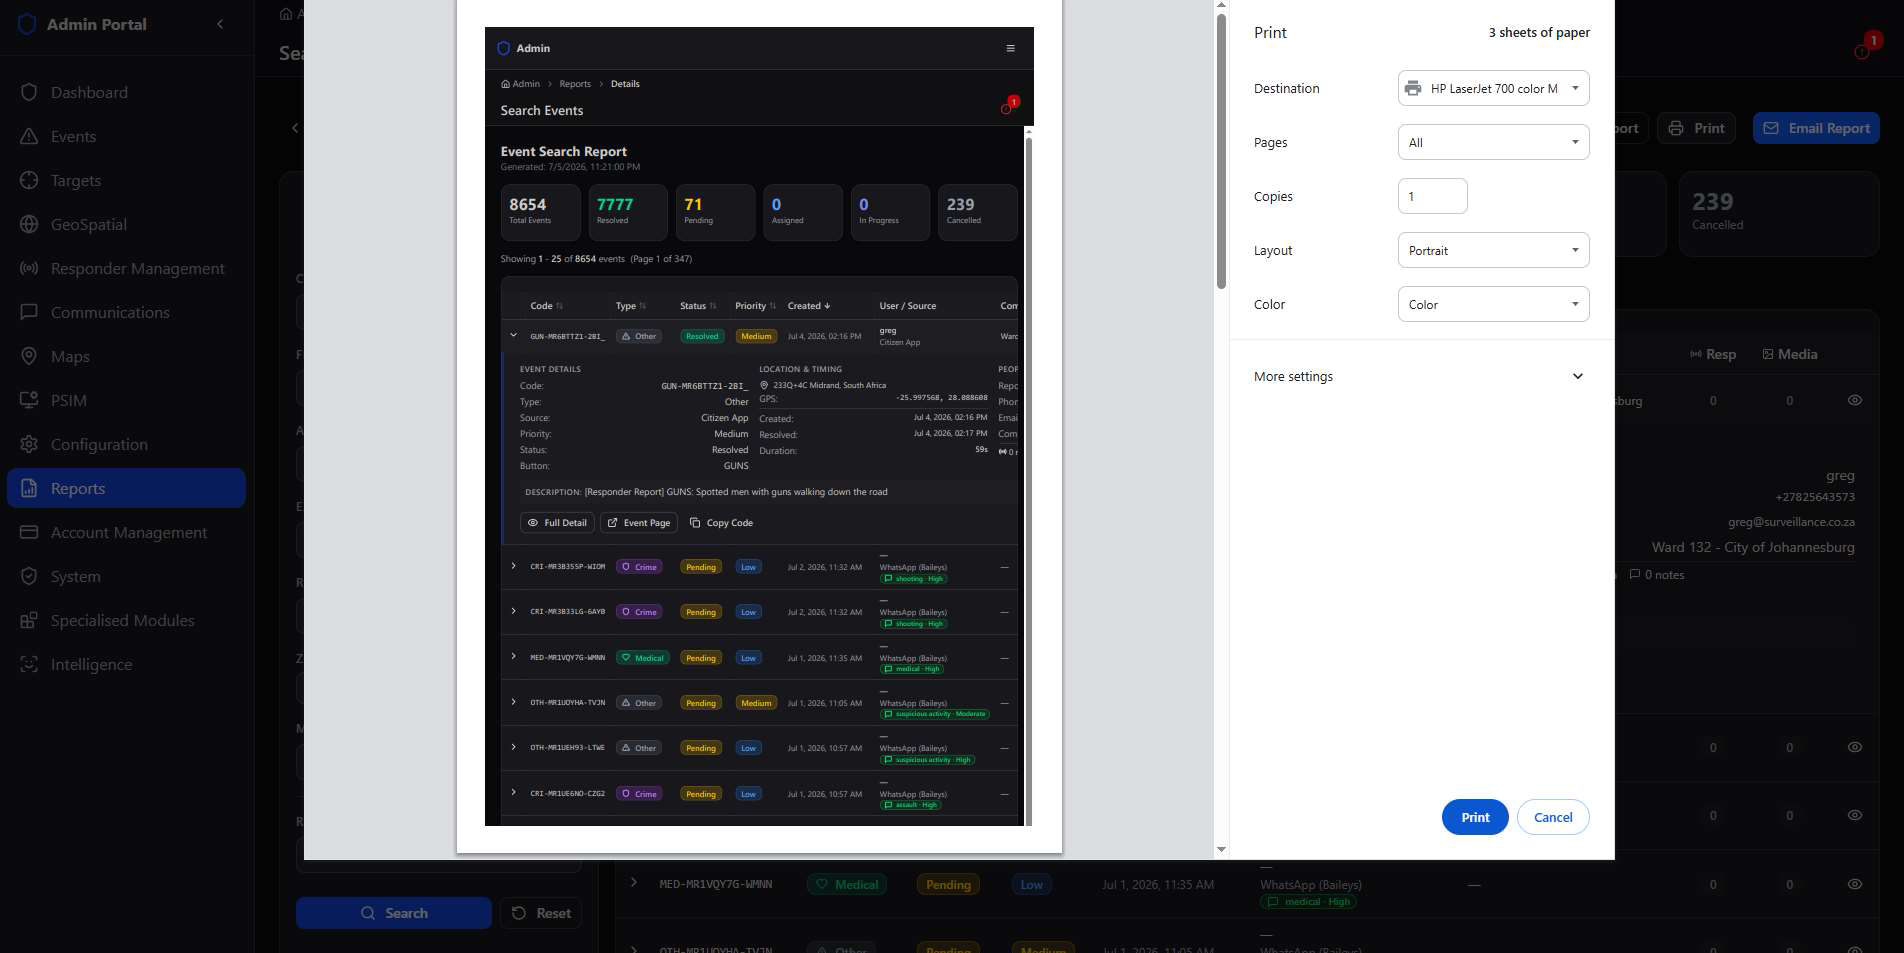
Email or push a report straight to stakeholders
Send Report supports two delivery methods — Email or Push Notification — with recipients pulled from Users, Communities, or a custom list, so a report reaches exactly the audience it's meant for.
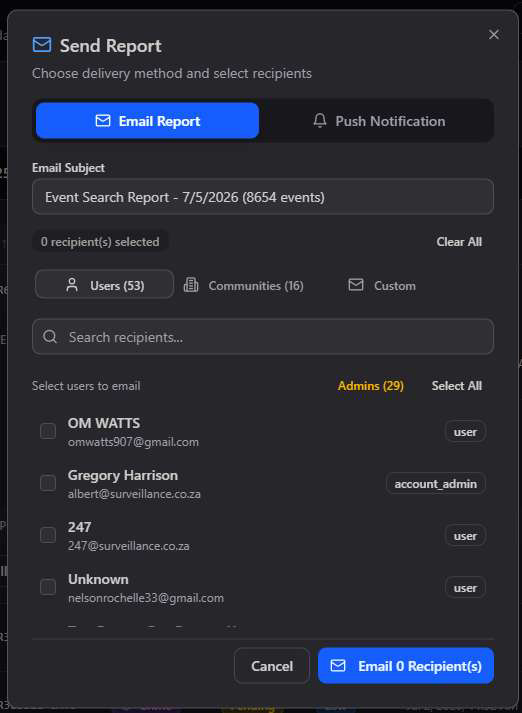
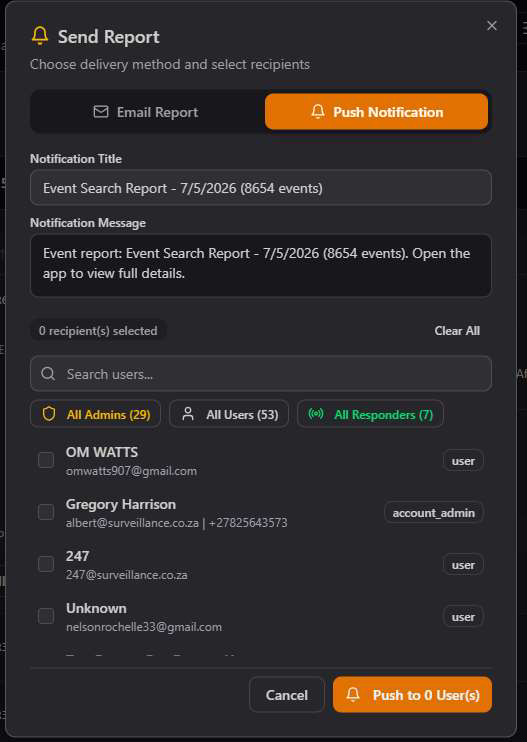
Schedule Report, at the top of the main Reports page, automates this entirely — set a cadence and a recipient list once, and the report generates and sends itself on schedule with no manual export needed.
The 14 Report Categories
Every dataset the platform tracks, pre-aggregated into ready-to-read reports.
Beyond Search Events, 59 more reports are organised into 14 categories — each one a focused lens on a single part of the operation.
Every category follows the same pattern — a date range picker, headline stat cards, one or more charts, a detailed data table, and CSV export — so once one report is familiar, all 60 are.
Management Dashboards
A high-level overview built for the people who don't need every row — just the trend.
Executive Summary rolls the entire operation into a single screen — total users, events, resolution rate, active responders, and communities — with an event trend chart and a category breakdown, over any custom date range.
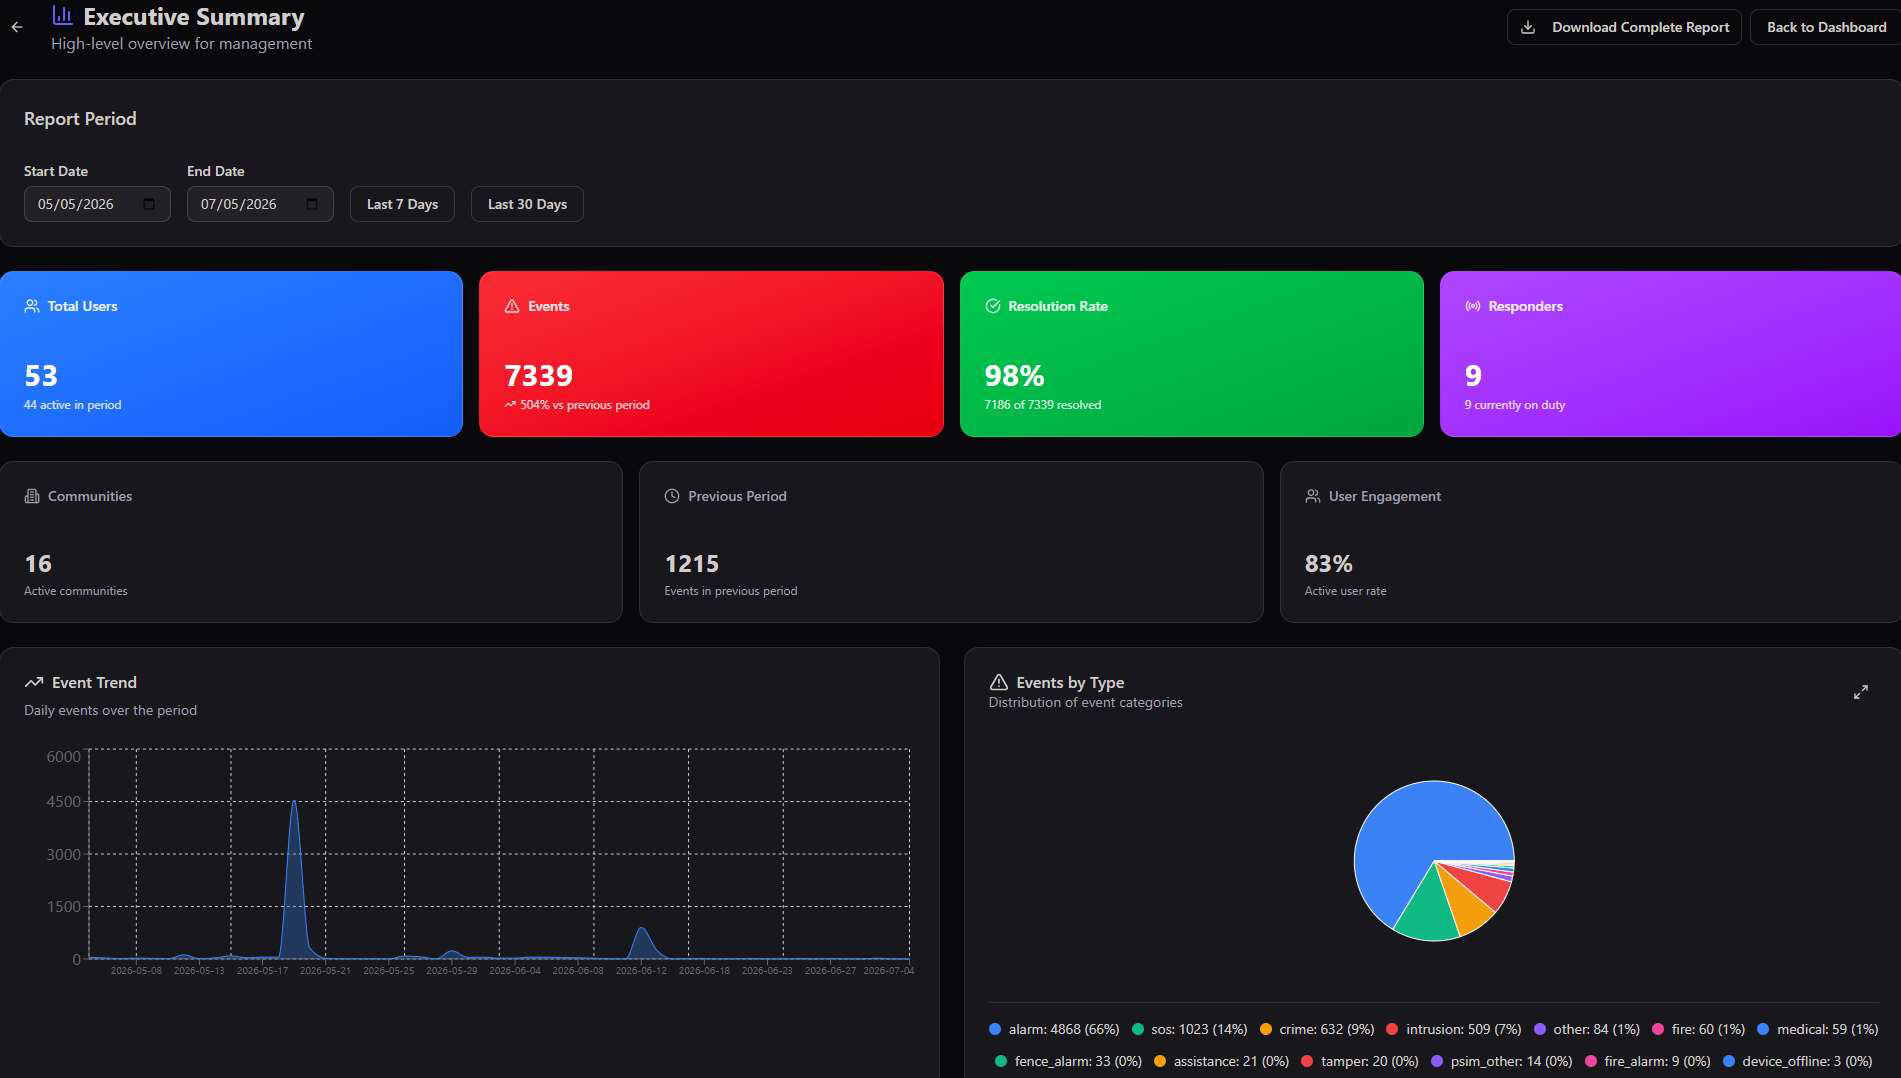
- Report Period — pick a custom Start/End Date, or use Last 7 Days / Last 30 Days shortcuts.
- Period-over-period comparison — Events and Previous Period sit side by side, showing the percentage swing at a glance.
- Event Trend — a daily area chart across the full report period, immediately surfacing spikes.
- Events by Type — a pie breakdown (alarm, SOS, crime, intrusion, fire, medical, and more) with exact counts and percentages.
- Download Complete Report — exports this entire dashboard as a single document for a board pack or client update.
Built for leadership, not operators. Where Search Events answers "what happened on this one case," Executive Summary and the Monthly/Weekly Dashboards under Management Reports answer "how is the operation trending" — the report to open before a client or stakeholder meeting.
Responder Reports
Timesheets, response times, and assignment performance for every responder on the platform.
Responder Reports tracks how the field team is actually performing — assignments taken, completed, declined, and how fast each responder accepts a job once it's assigned.
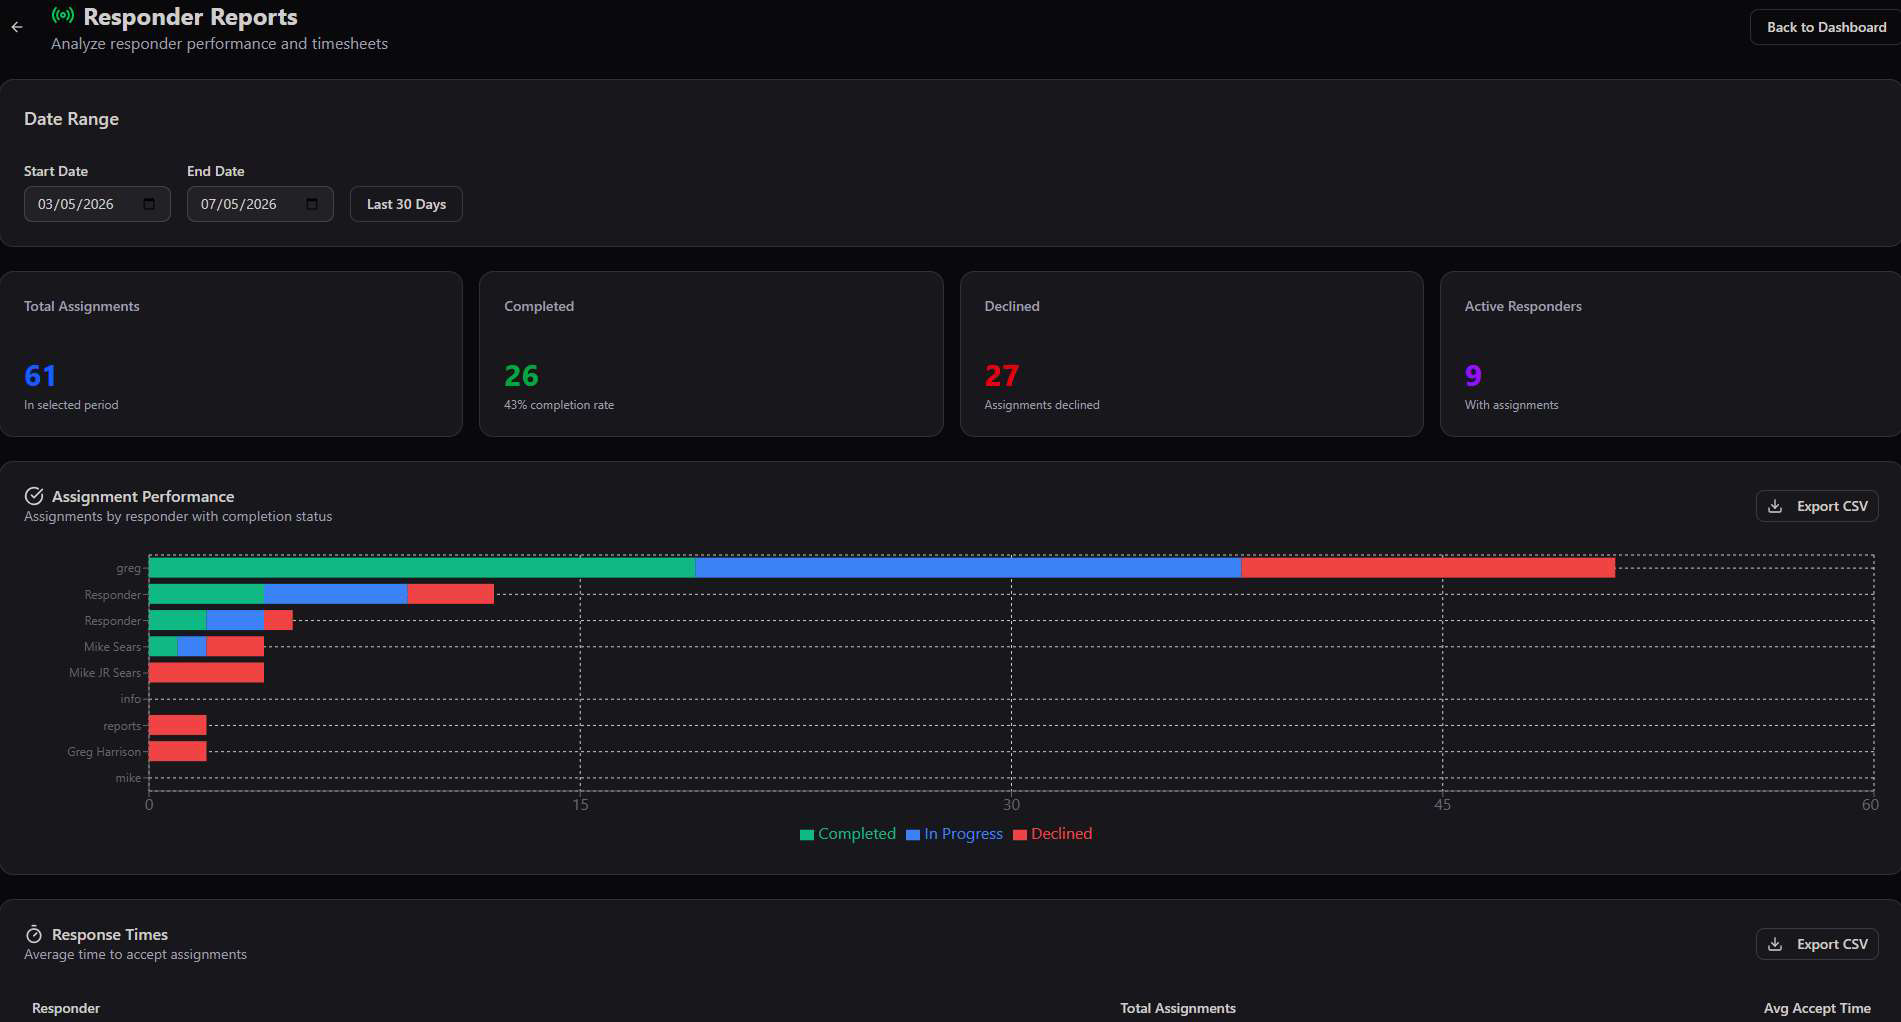
- Assignment Performance — a per-responder stacked bar of Completed / In Progress / Declined, immediately flagging anyone with a high decline rate.
- Response Times — average time to accept an assignment, per responder, exportable to CSV for payroll or performance review.
- Responder Timesheets — one of the 6 reports in this category, tracking logged hours against shifts and patrols.
Use it for accountability, not just oversight. A responder with a high Declined count and slow Avg Accept Time is a coaching conversation waiting to happen — this report surfaces it before it becomes a missed emergency.
WhatsApp Intelligence Reports
The deepest report category on the platform — 8 tabs turning raw community WhatsApp group chatter into classified, actionable intelligence.
WhatsApp Intel Reports is where AI-monitored community WhatsApp groups become a structured intelligence product — threat levels, sentiment, sender behaviour, geography, and activity patterns, all built from the same message stream that feeds the platform's AI classification engine.
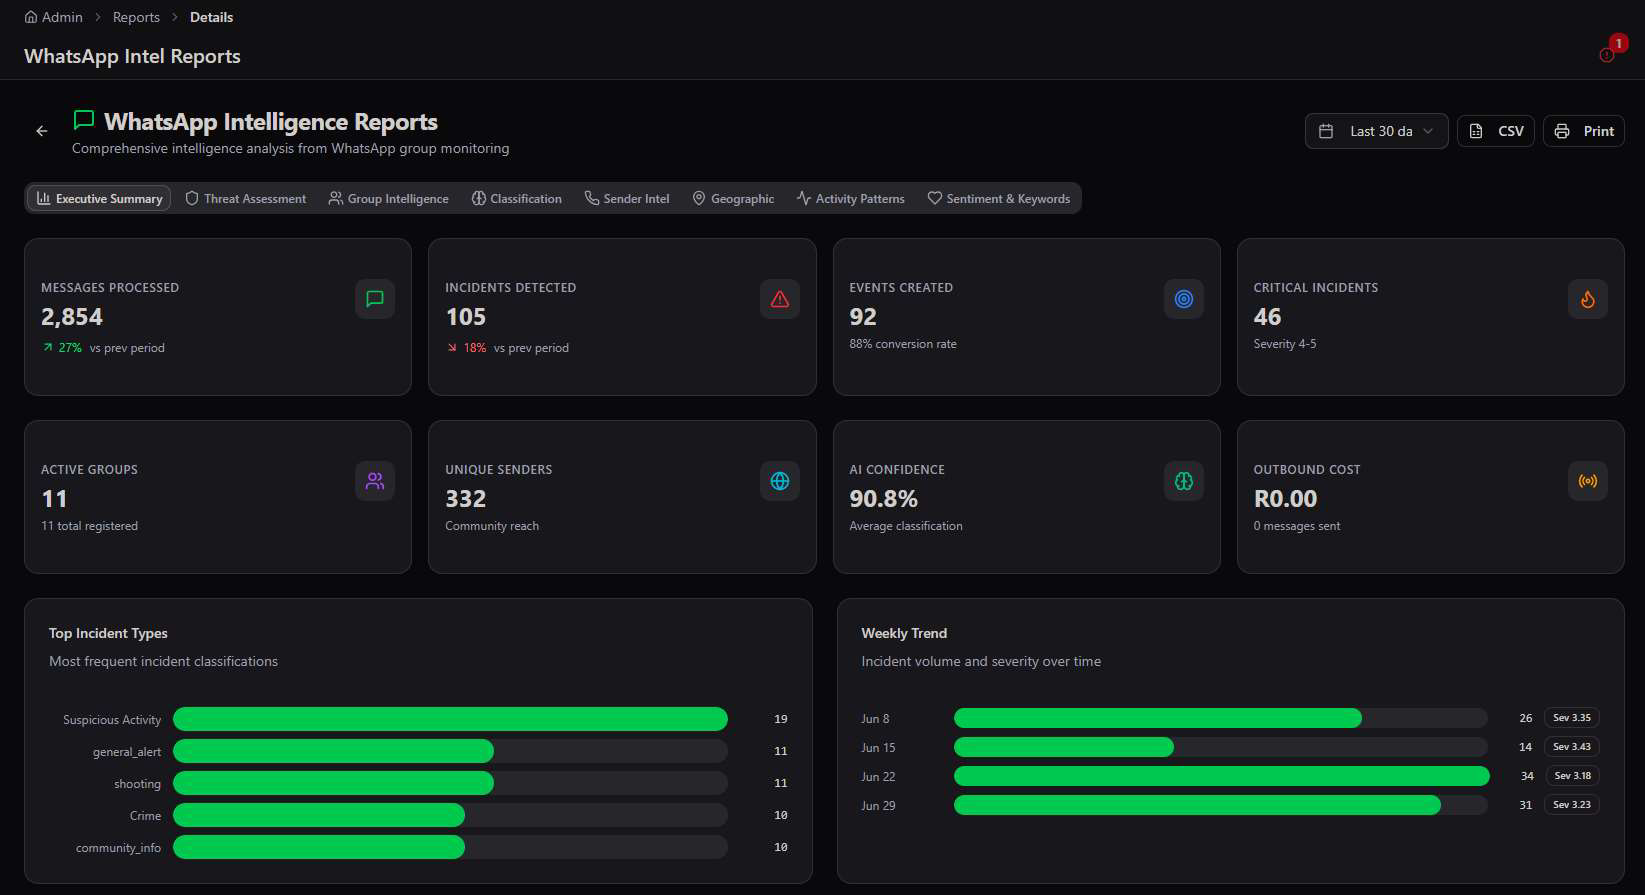
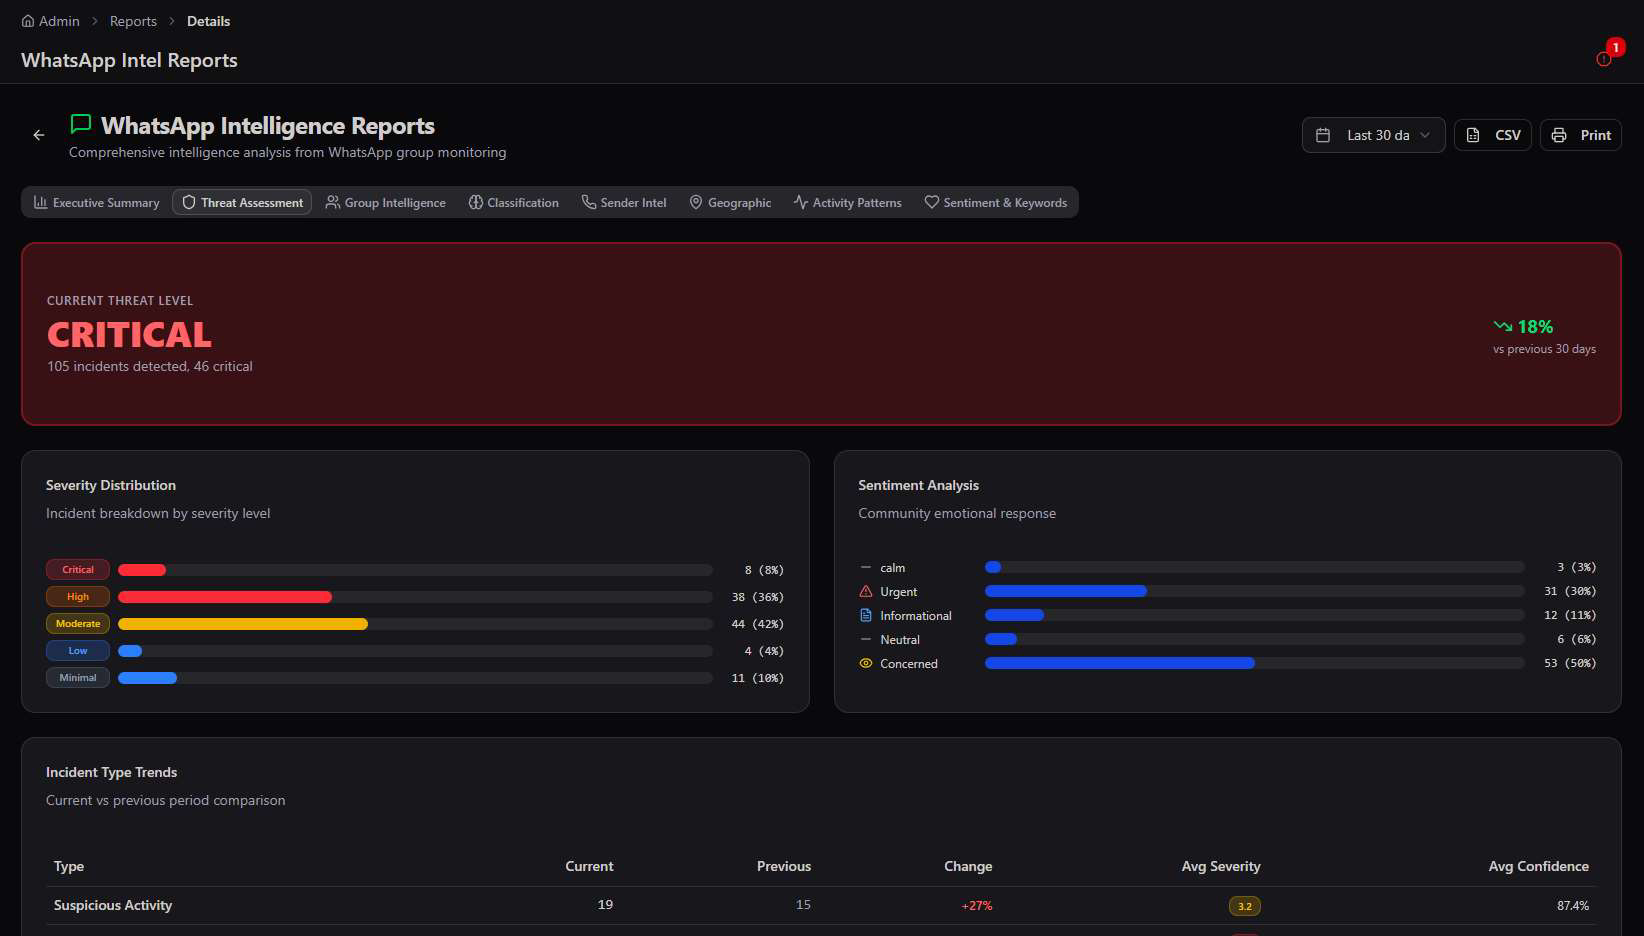
Threat Assessment — the headline number
A live Current Threat Level banner (Critical / High / Moderate / Low) backed by a full severity distribution and community sentiment analysis, so a control room supervisor can gauge the mood of the community at a glance.
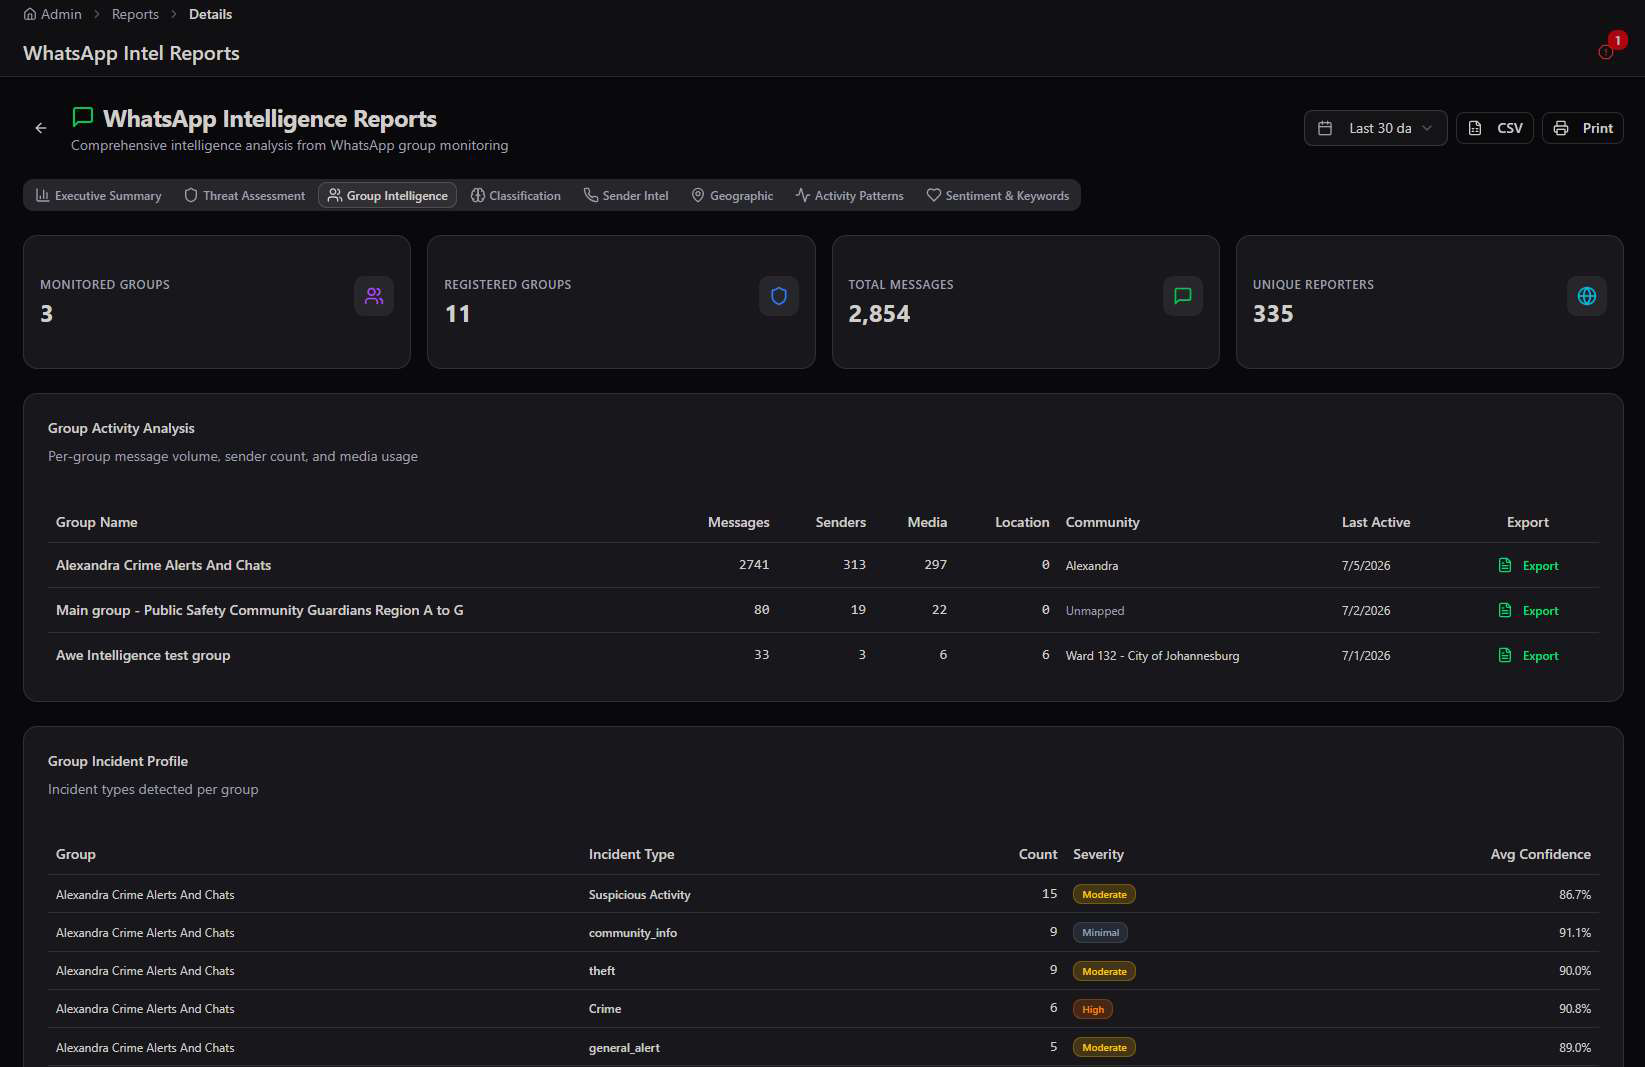
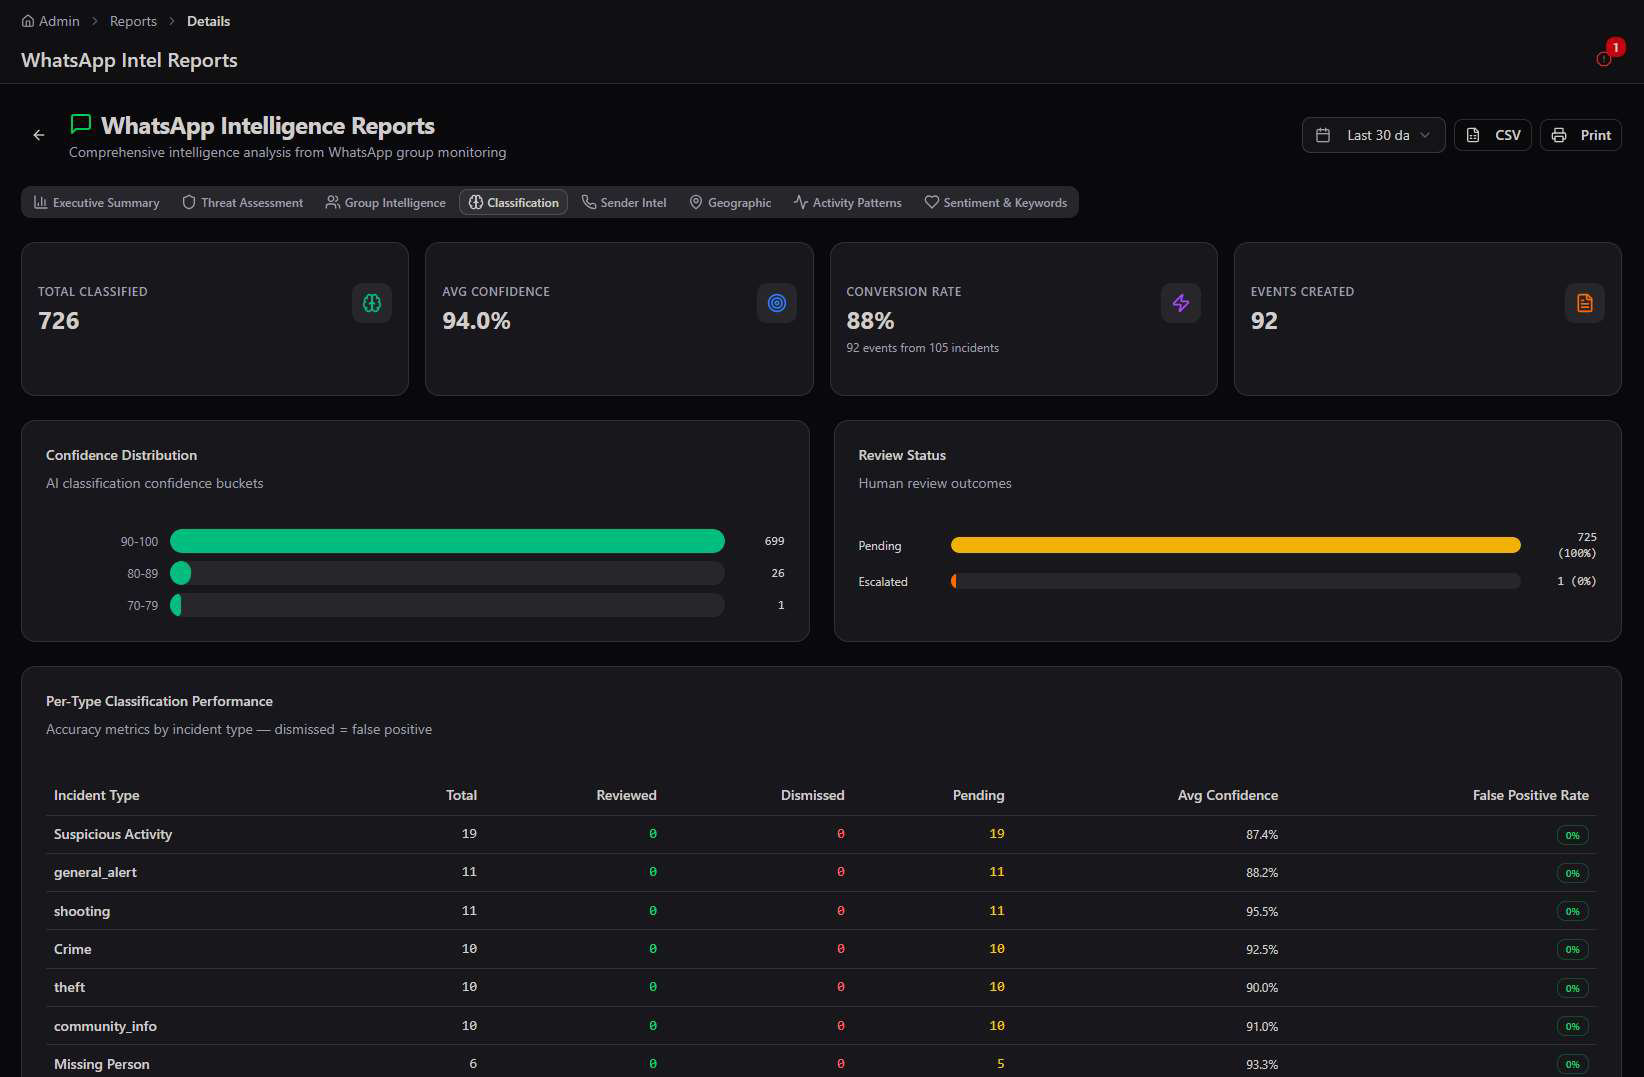
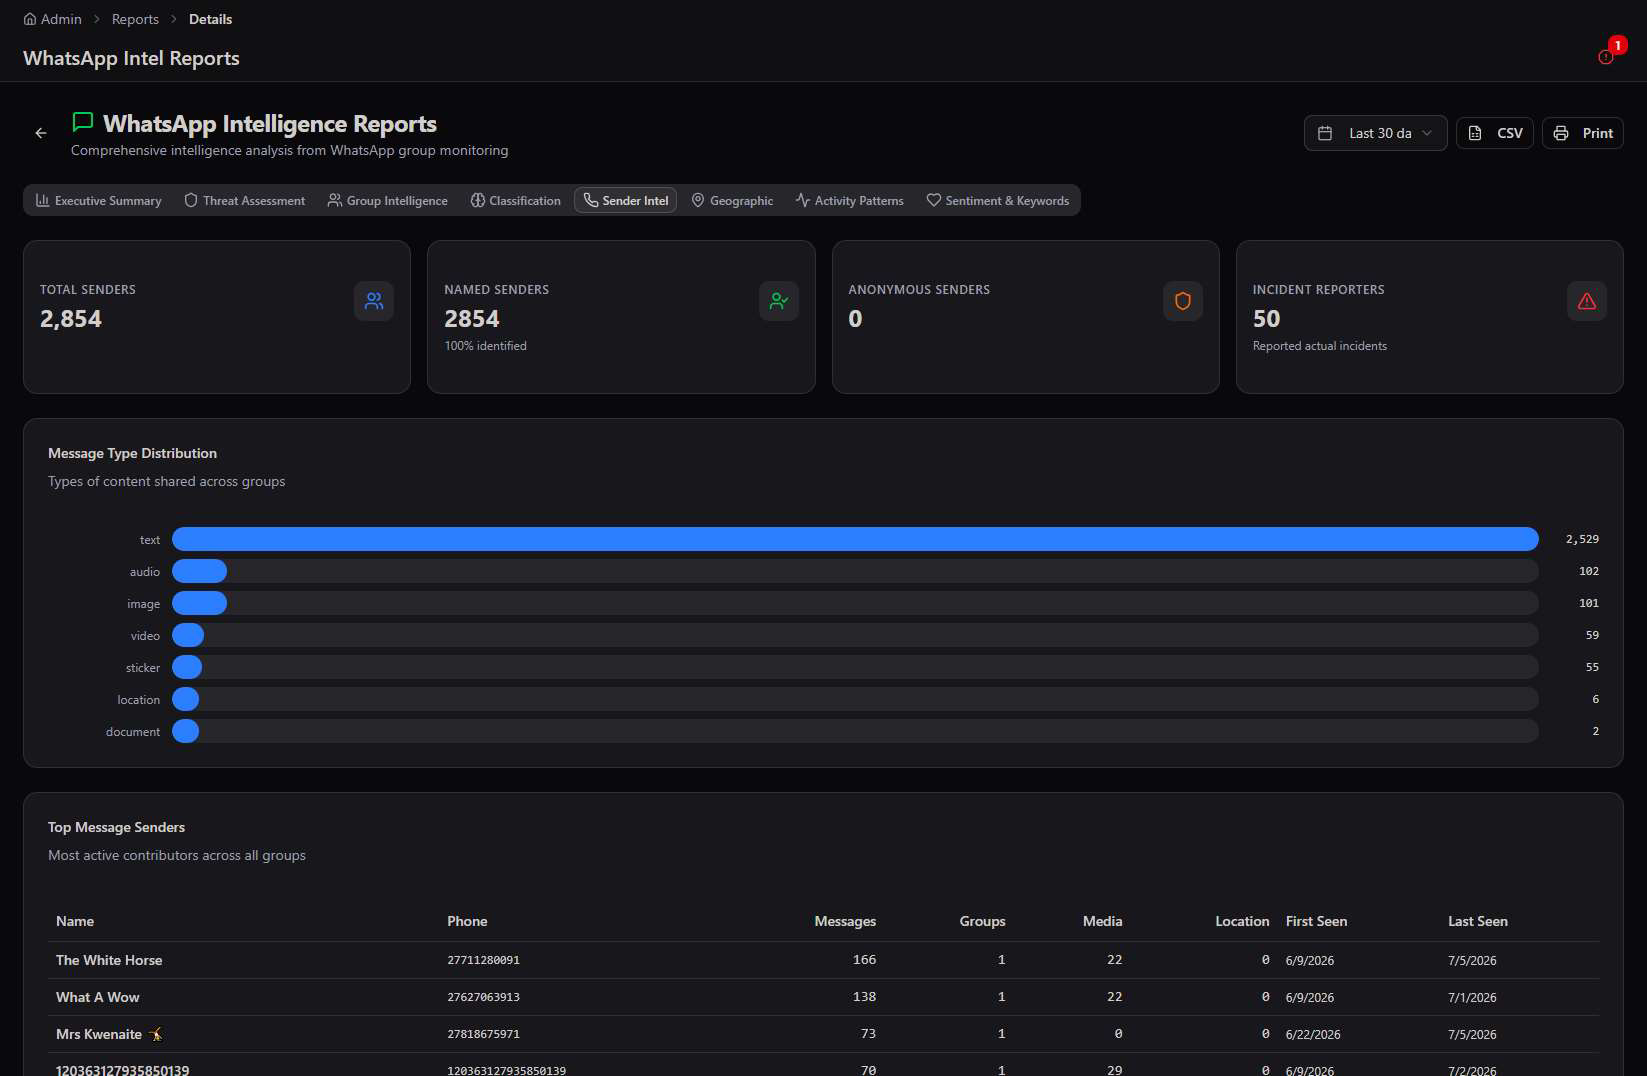
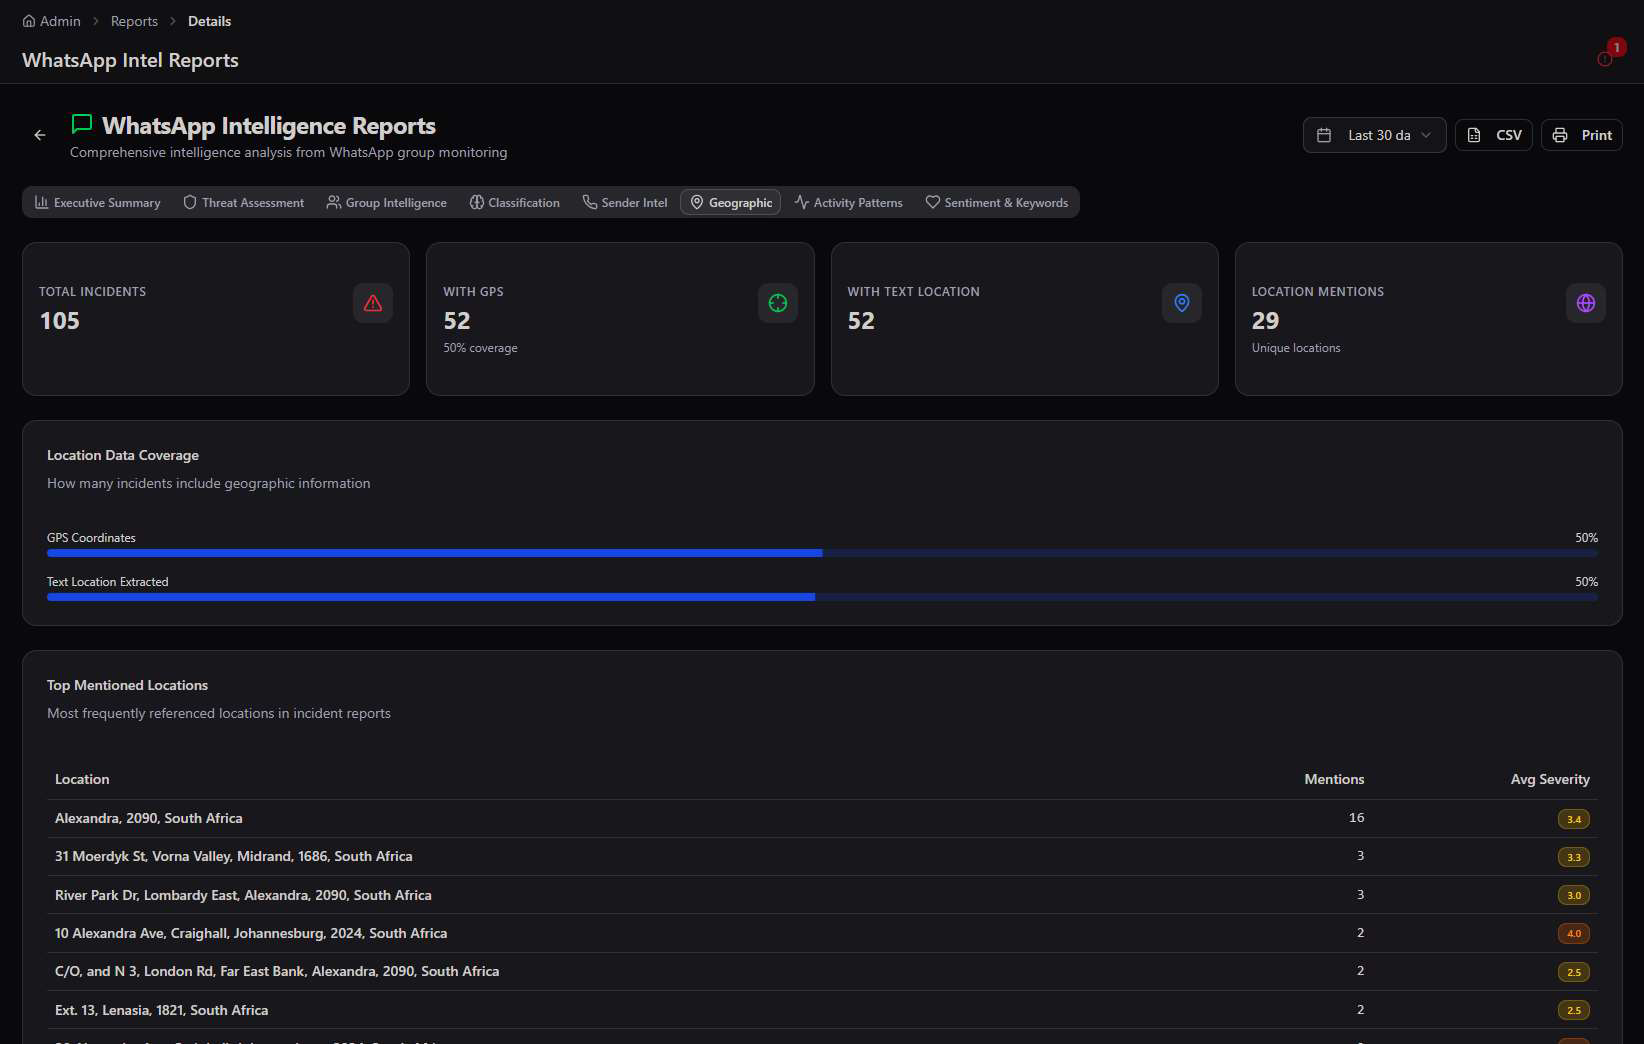
Activity Patterns & Sentiment
A full weekly activity heatmap pinpoints peak monitoring windows by day and hour, while Sentiment & Keywords extracts the emotional tone and most common terms across every classified message — useful for spotting an emerging concern before it's reported as a formal incident.
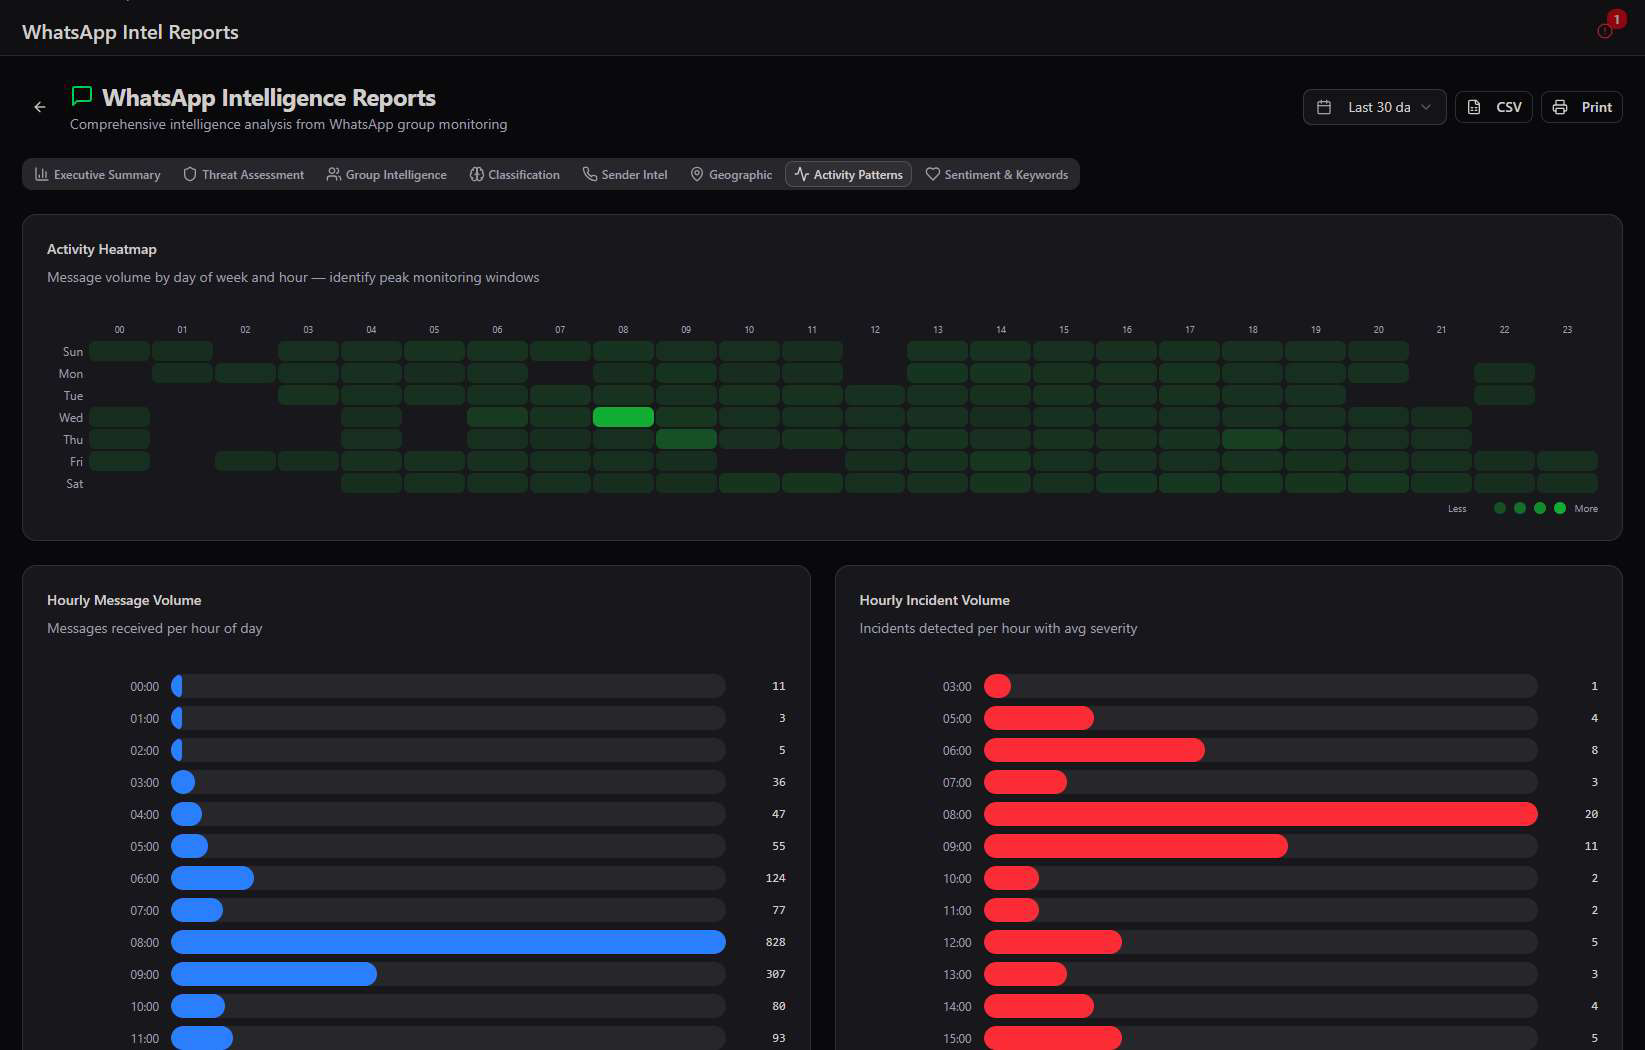
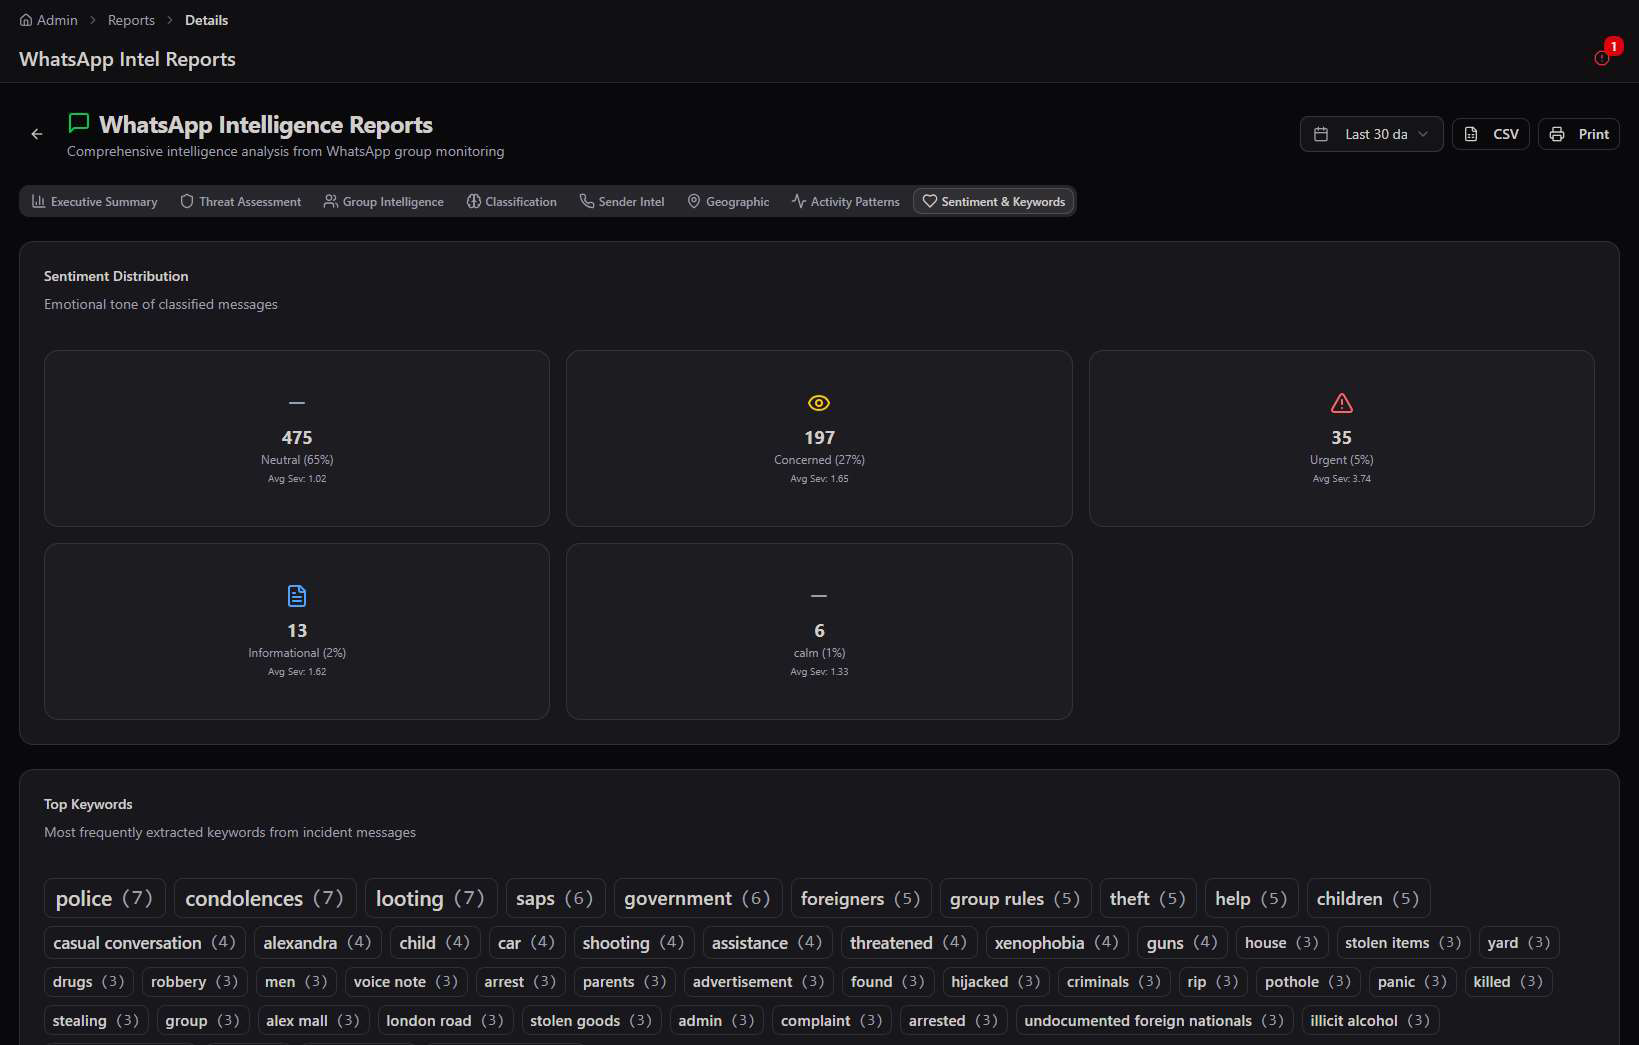
From chatter to case file. The 88% conversion rate on the Classification tab means the vast majority of AI-detected incidents in community WhatsApp groups are automatically becoming real, trackable events — turning informal community reporting into the same structured record as a 911-style panic press.
Operations Reports
Patrols, Health Checks, Digital OB, Geofence, and Smartpoles — the day-to-day field operation, in one tabbed view.
Operations Reports groups five field-operations datasets under one date range picker and a shared tab strip, so a supervisor can move between patrol coverage, welfare checks, and occurrence book entries without leaving the screen.
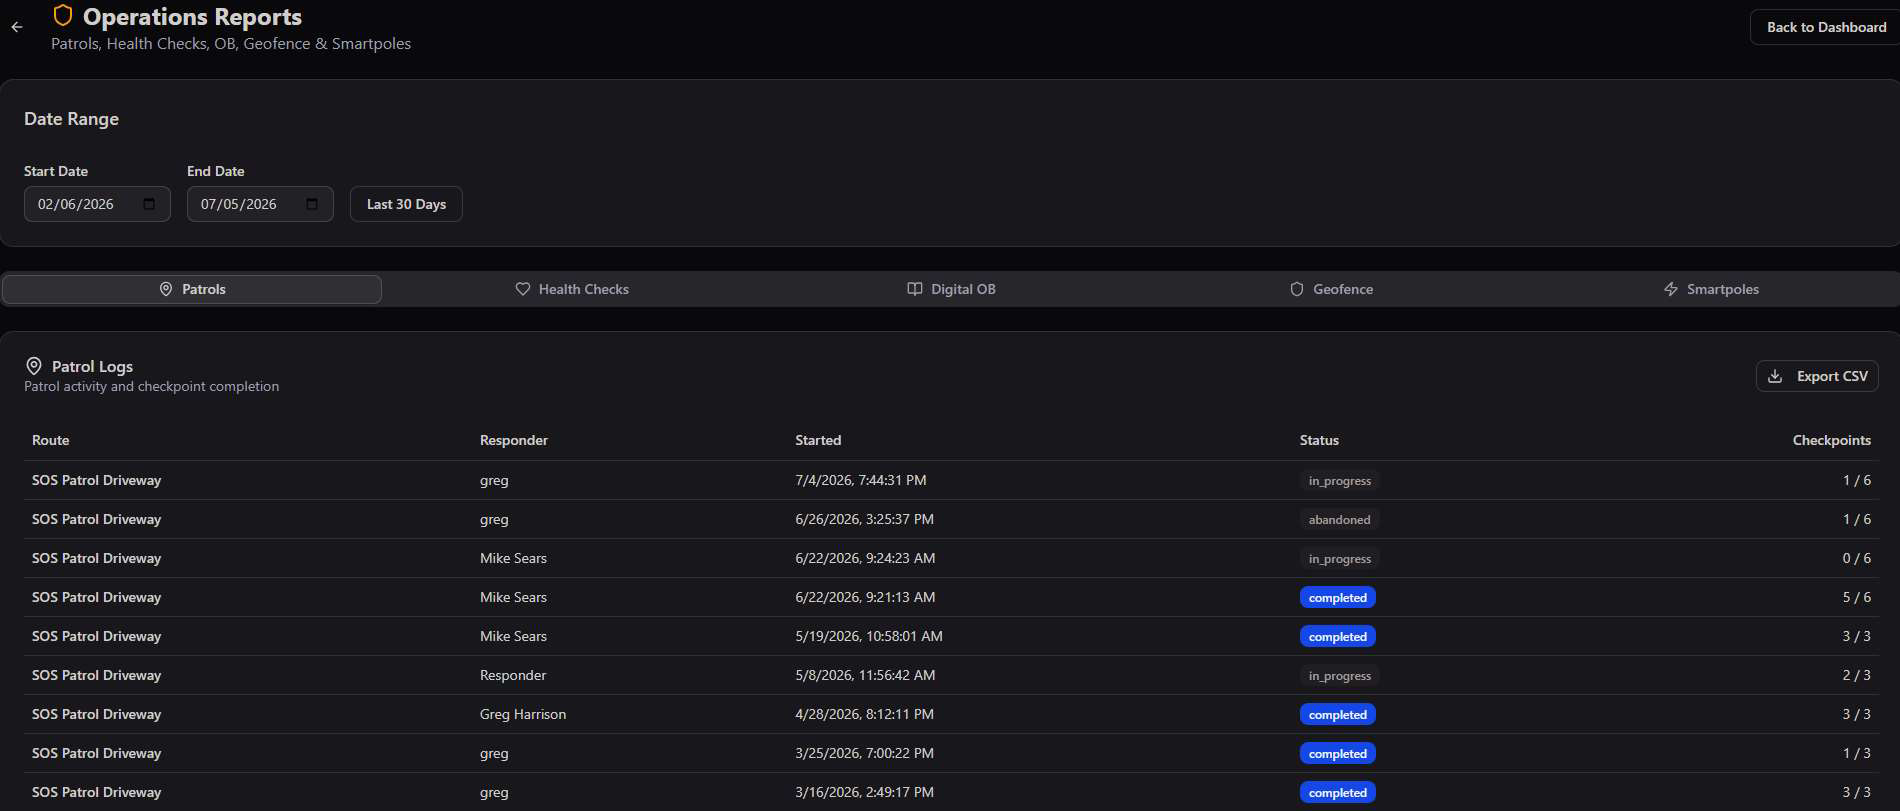
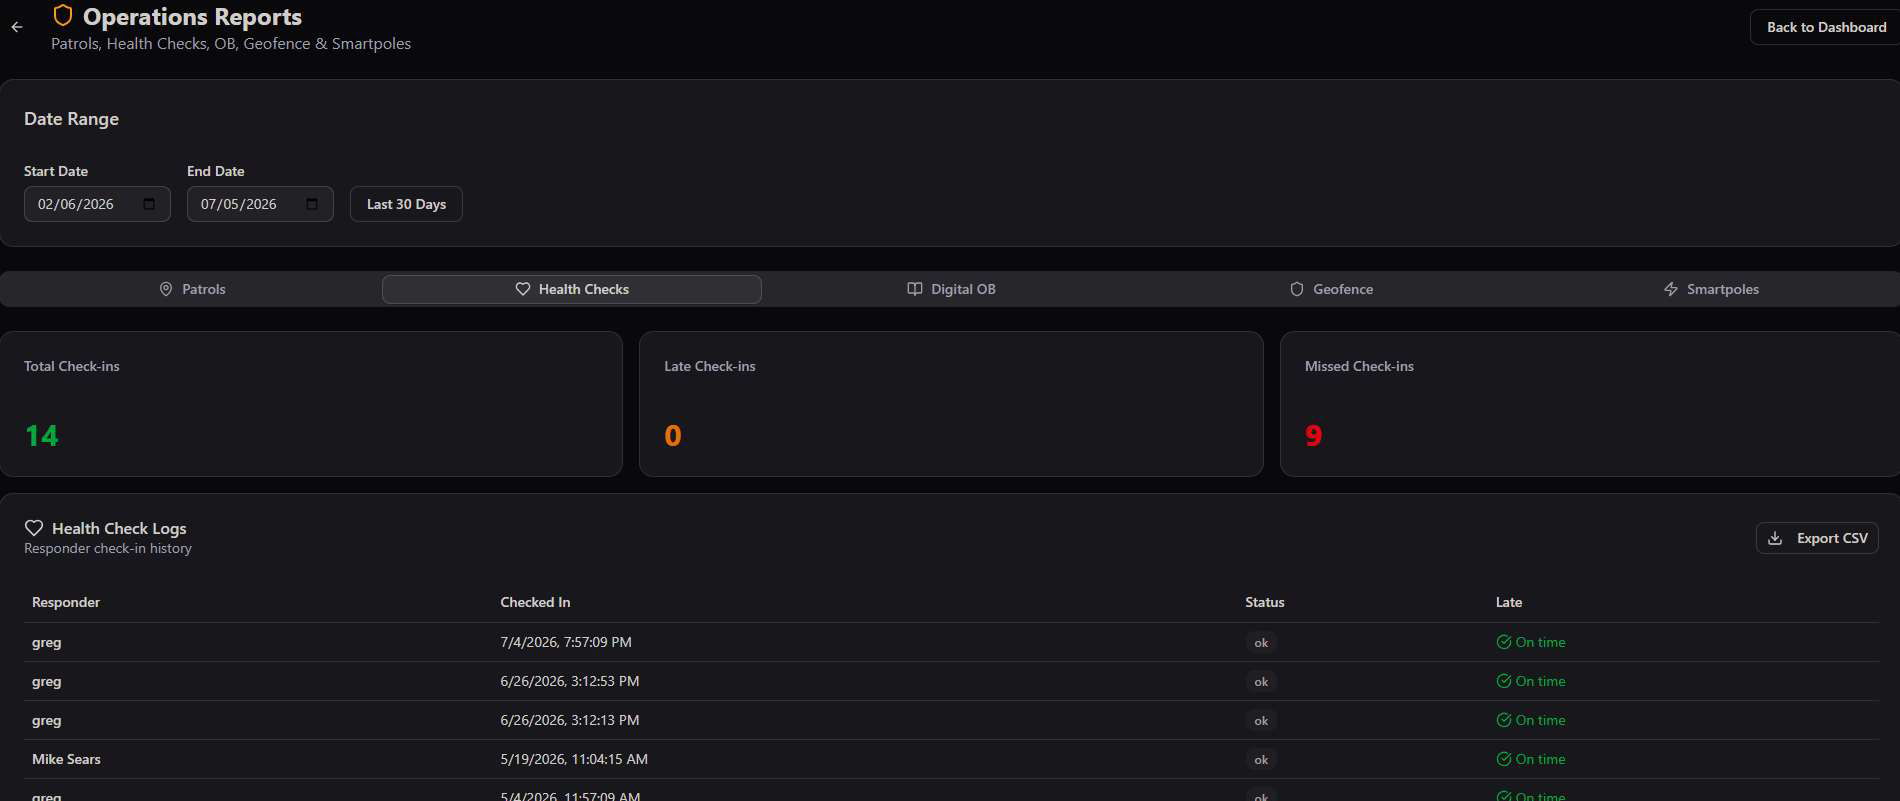
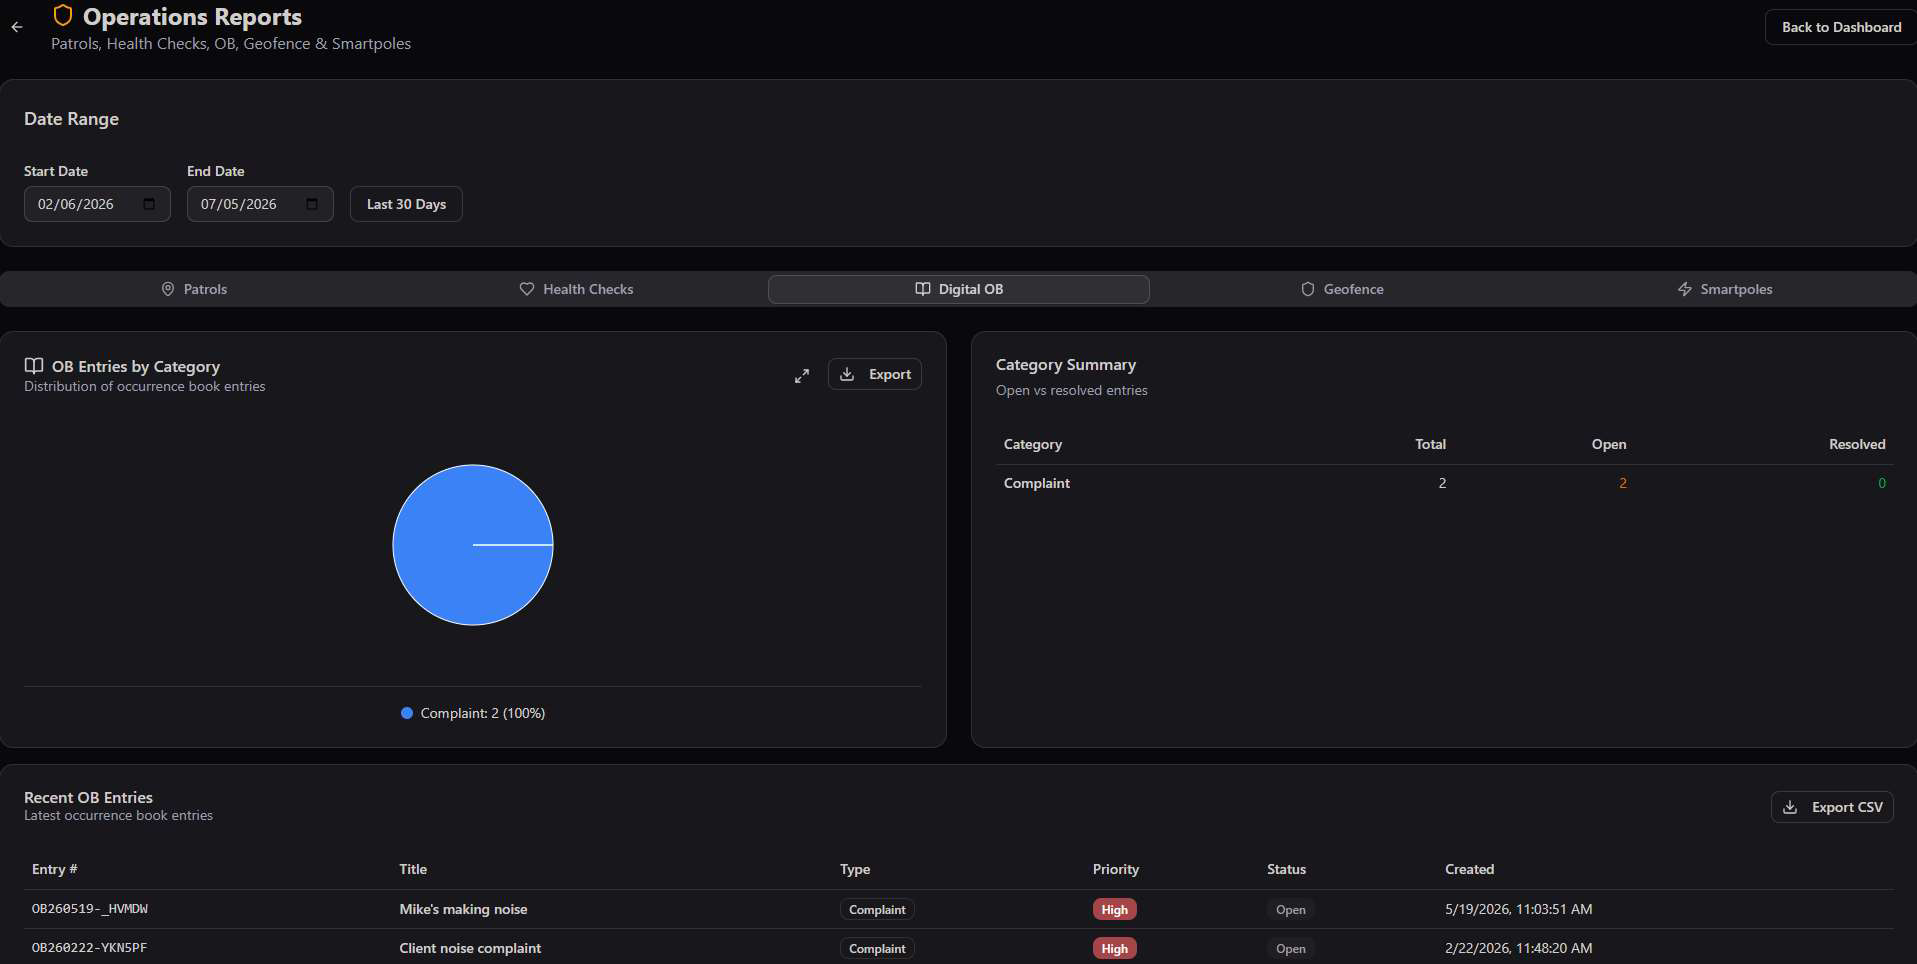
The remaining two tabs, Geofence and Smartpoles, follow the same pattern — zone alert activity and boundary-crossing events for Geofence, device status and sensor readings for Smartpoles — each with its own Export CSV.
Missed Check-ins matters most. A responder who misses a scheduled Health Check has gone silent in the field — this count should be checked first on any shift handover, before patrol coverage or OB entries.
Custom Reports
If the metric you need isn't one of the 60 — it doesn't have to stay that way.
The 60 reports across 14 categories cover the vast majority of day-to-day, monthly, and executive reporting needs — but every deployment eventually asks for a cross-cutting metric, a client-specific KPI, or a combination view the standard library wasn't built for.
If it's not already there, it can be built. Any admin who needs a report outside the standard 60 can request a fully customised report — built to the exact fields, filters, visual format, and delivery schedule required. Chat to our Dev Team to scope it out.