Admin User Guide · GeoSpatial Module

Every boundary.
Every building.
One map layer.

The AWE Initiative GeoSpatial module is the platform's geographic backbone — South African ward boundaries, emergency services facilities, full municipal structures, and custom monitoring zones, all as reusable geographic building blocks the rest of the platform draws on.

🗺️ Ward Boundaries 🏥 Emergency Facilities 🏛️ Municipal Structures 📐 Custom Geofences 🇿🇦 South African Coverage
4,392
Wards loaded
3,591
Emergency facilities
9
Municipalities configured
30
Active geofence zones
Scroll to begin ↓
Overview

GeoSpatial at a glance

Four geographic registries that turn raw addresses into governed boundaries, facilities, and monitoring zones.
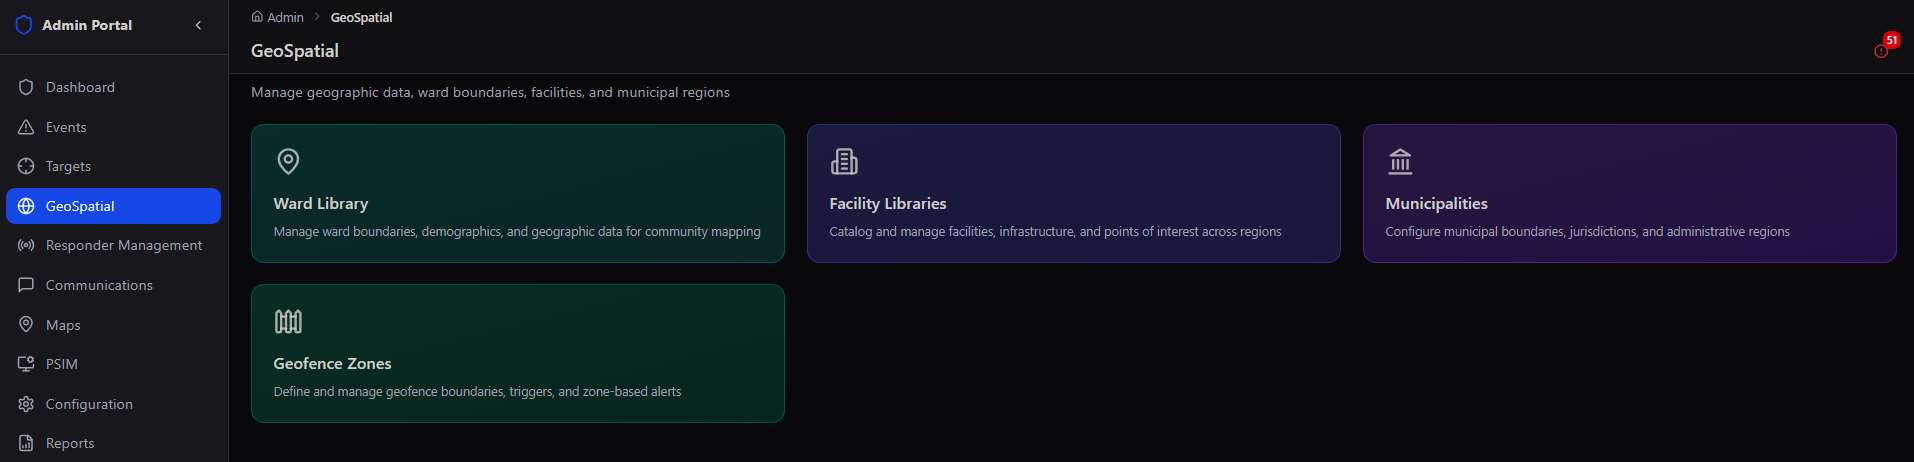
GeoSpatial module dashboard
GeoSpatial → the landing dashboard: Ward Library, Facility Libraries, Municipalities, and Geofence Zones

Every other module on the platform eventually needs to answer a geographic question — which ward is this event in, which police station is nearest, which municipal department owns this issue, has this target entered a restricted zone? GeoSpatial is where those answers live, sourced from real South African administrative and emergency services data.
Ward Library module tile
Ward Library
Facility Libraries module tile
Facility Libraries
Municipalities module tile
Municipalities
Geofence Zones module tile
Geofence Zones
🗺️
Ward Library
Manage ward boundaries, demographics, and geographic data for community mapping — imported directly from official SA ward data.
🏛️
Facility Libraries
Catalog and manage facilities, infrastructure, and points of interest — SAPS stations, hospitals, clinics, and fire stations across every region.
🏢
Municipalities
Configure municipal boundaries, jurisdictions, and administrative regions, complete with departments, contacts, and organograms.
📐
Geofence Zones
Define and manage geofence boundaries, triggers, and zone-based alerts for any custom monitoring area.

Real South African geographic data, not placeholders. The Ward Library ships with 4,392 wards already loaded; Facility Libraries imports directly from SAPS and Department of Planning, Monitoring & Evaluation datasets. GeoSpatial gives every deployment a governed, accurate starting map on day one.

Module 01

Ward Library

Official South African municipal ward boundaries, imported once and reused everywhere community geofencing matters.

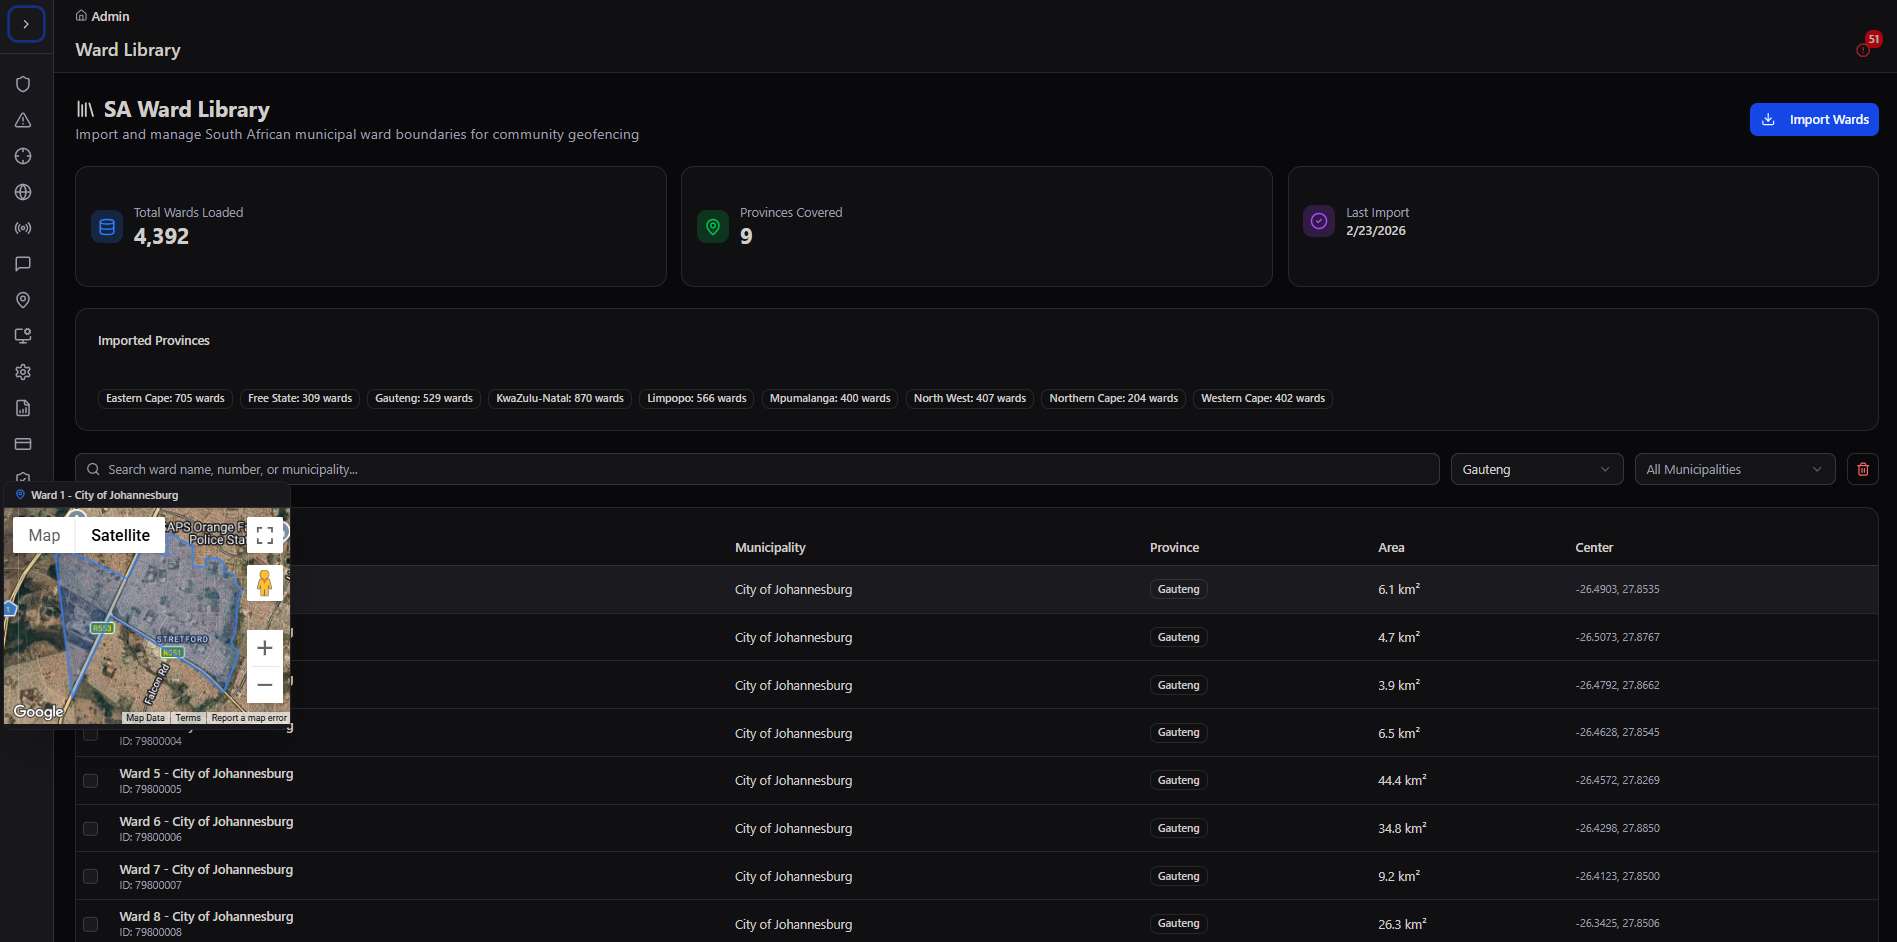
Rather than asking every admin to hand-draw a community's boundary, the Ward Library imports South Africa's official ward geometry directly — 4,392 wards and counting, each with its municipality, province, area, and centre coordinates ready to use as a Community geofence in the Targets module.
Ward Library main screen
Ward Library → 4,392 wards loaded, 9 provinces covered, with imported ward boundaries listed by municipality and area

Finding the right ward

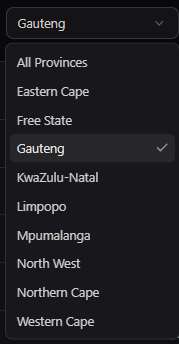
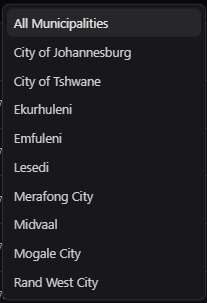
Search by ward number, municipality, or address, then narrow using the Province and Municipality filters — essential when working across a dataset covering the entire country.
Province filter dropdown
Province filter → all nine provinces, from Eastern Cape to Western Cape
Municipality filter dropdown
Municipality filter → narrows the ward list to a single municipality, like City of Johannesburg

Ward detail

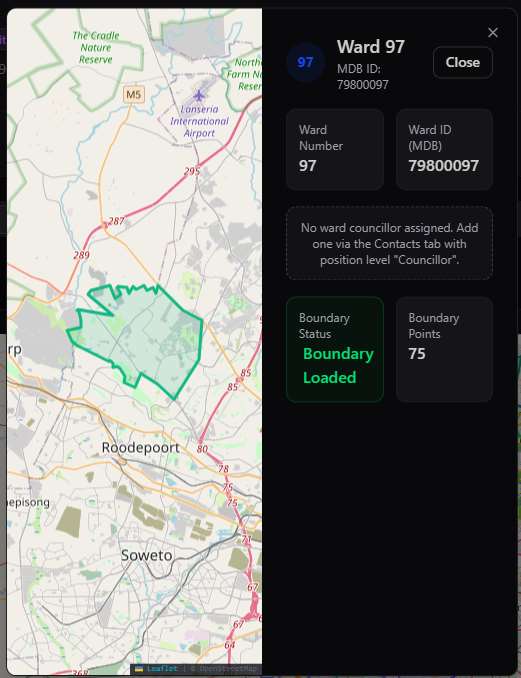
Selecting a ward on the map opens a detail card confirming its ward number, MDB ward ID, boundary status, and number of boundary points — plus a prompt to assign a councillor if one hasn't been linked yet.
Ward detail popup on the map
Ward 97 → boundary loaded with 75 boundary points; no councillor assigned yet
📥
Bulk province import
Import an entire province's ward boundaries in one action — the dashboard shows import counts per province, from 725 wards in the Western Cape to 27 in the Northern Cape.
👤
Councillor assignment
Link a ward councillor to a ward directly from its boundary popup, connecting political representation to the geographic record.
📏
Area & centre data
Every ward carries its area in square kilometres and a centre coordinate — ready reference points for reporting and map centring.
🔗
Feeds Community geofencing
A ward's boundary can be used directly as a Community's geofence in the Targets module — no need to redraw a polygon that already exists officially.

Shortcuts, not redrawing. Because Ward Library already holds official boundary data, creating a new Community for "Ward 132 - City of Johannesburg" takes one click against the existing ward — not a manual polygon-drawing exercise.

Module 02

Facility Libraries

Every SAPS police station, hospital, clinic, and fire station — catalogued, mapped, and one click from any event.

Facility Libraries is a nationwide directory of emergency services infrastructure. Rather than relying on generic map search, the platform imports authoritative SAPS station data and Department of Planning, Monitoring & Evaluation facility records — so "nearest hospital" or "nearest police station" in Event Processing is always answered from a verified source.
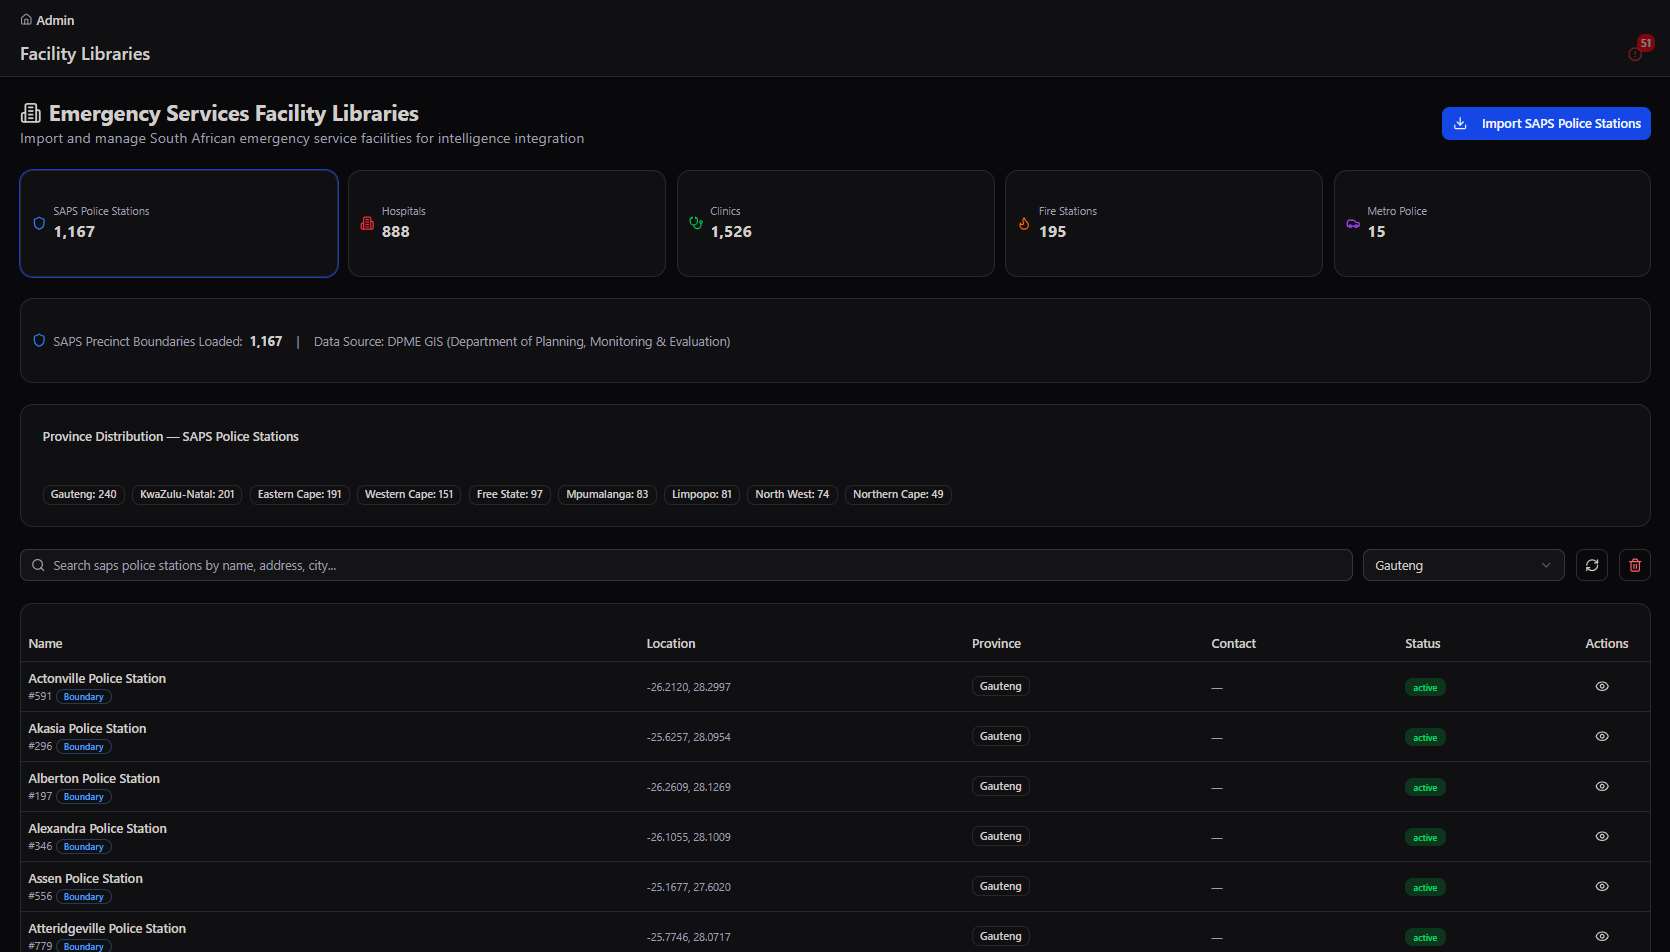

Facility Libraries overview
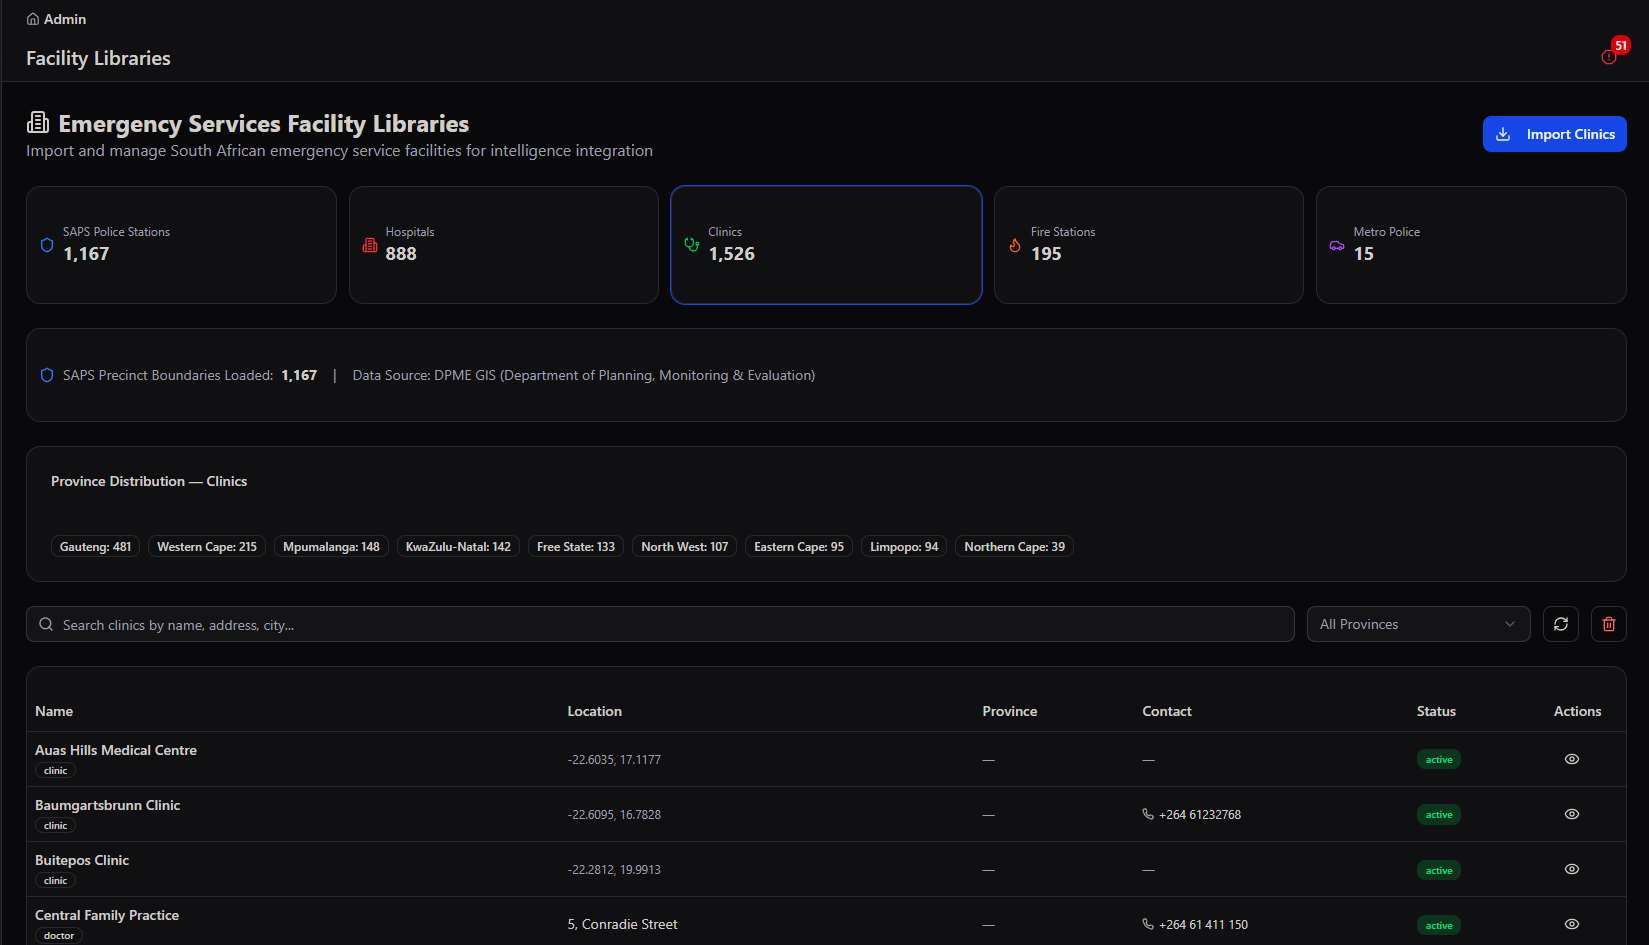
Facility Libraries → 1,167 SAPS police stations, 888 hospitals, 1,526 clinics, and 195 fire stations, with province distribution and full search
Facility count stat bar
Facility counts stay visible at the top of every view — SAPS, hospitals, clinics, fire stations, and safety police

Importing and filtering

Import SAPS Police Stations in bulk with a single action, then filter the combined facility list by province to focus on a specific region. The province distribution chart shows exactly how facility counts break down nationally, from 240 in Gauteng to 45 in Northern Cape.
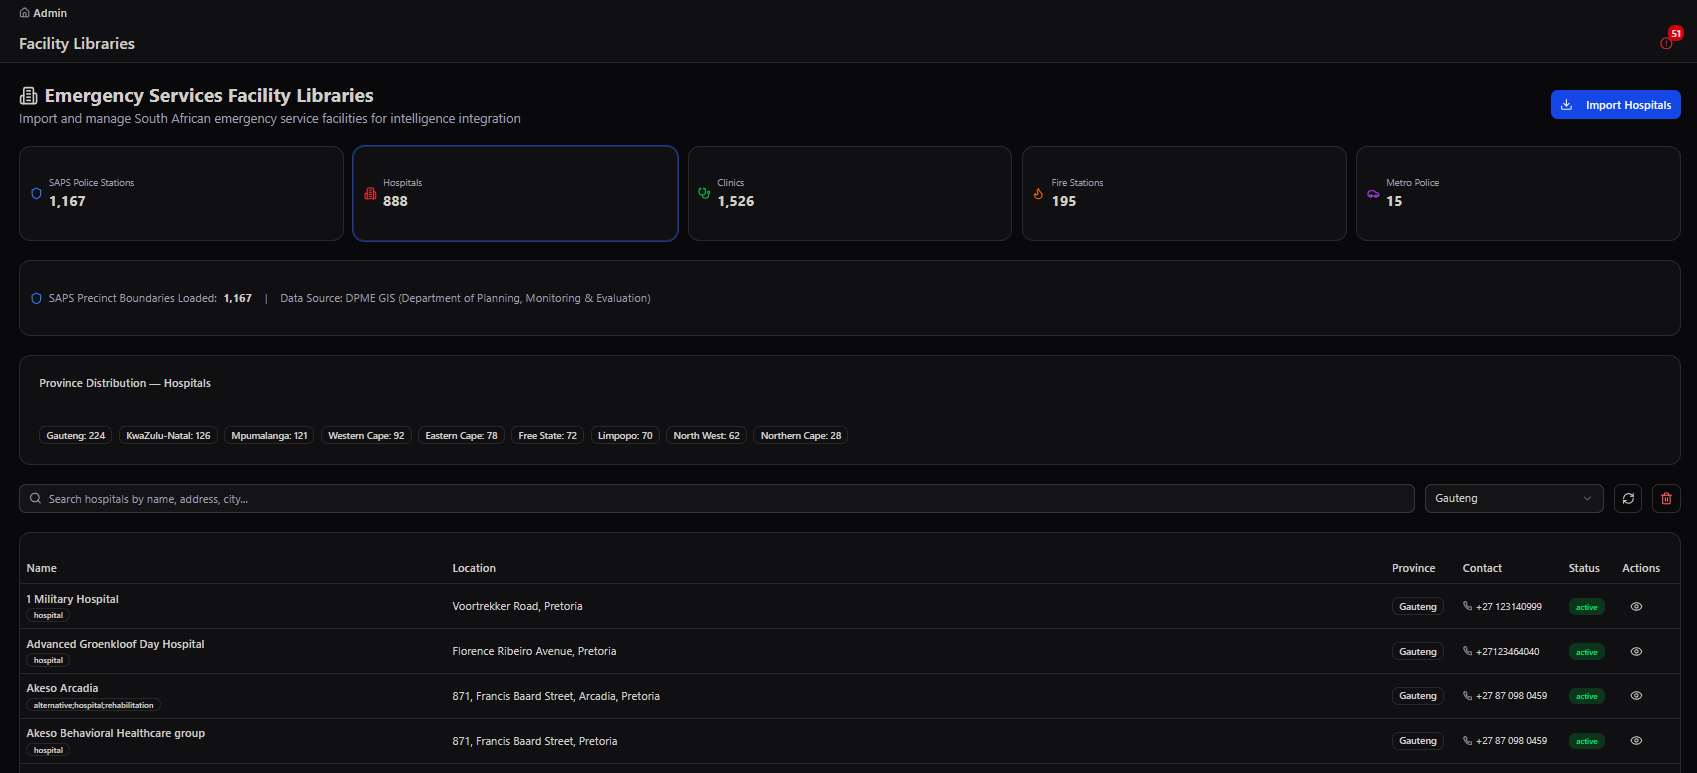
Facility Libraries with import action highlighted
Import SAPS Police Stations → pulls the latest official station data straight into the shared facility directory

Facility detail records

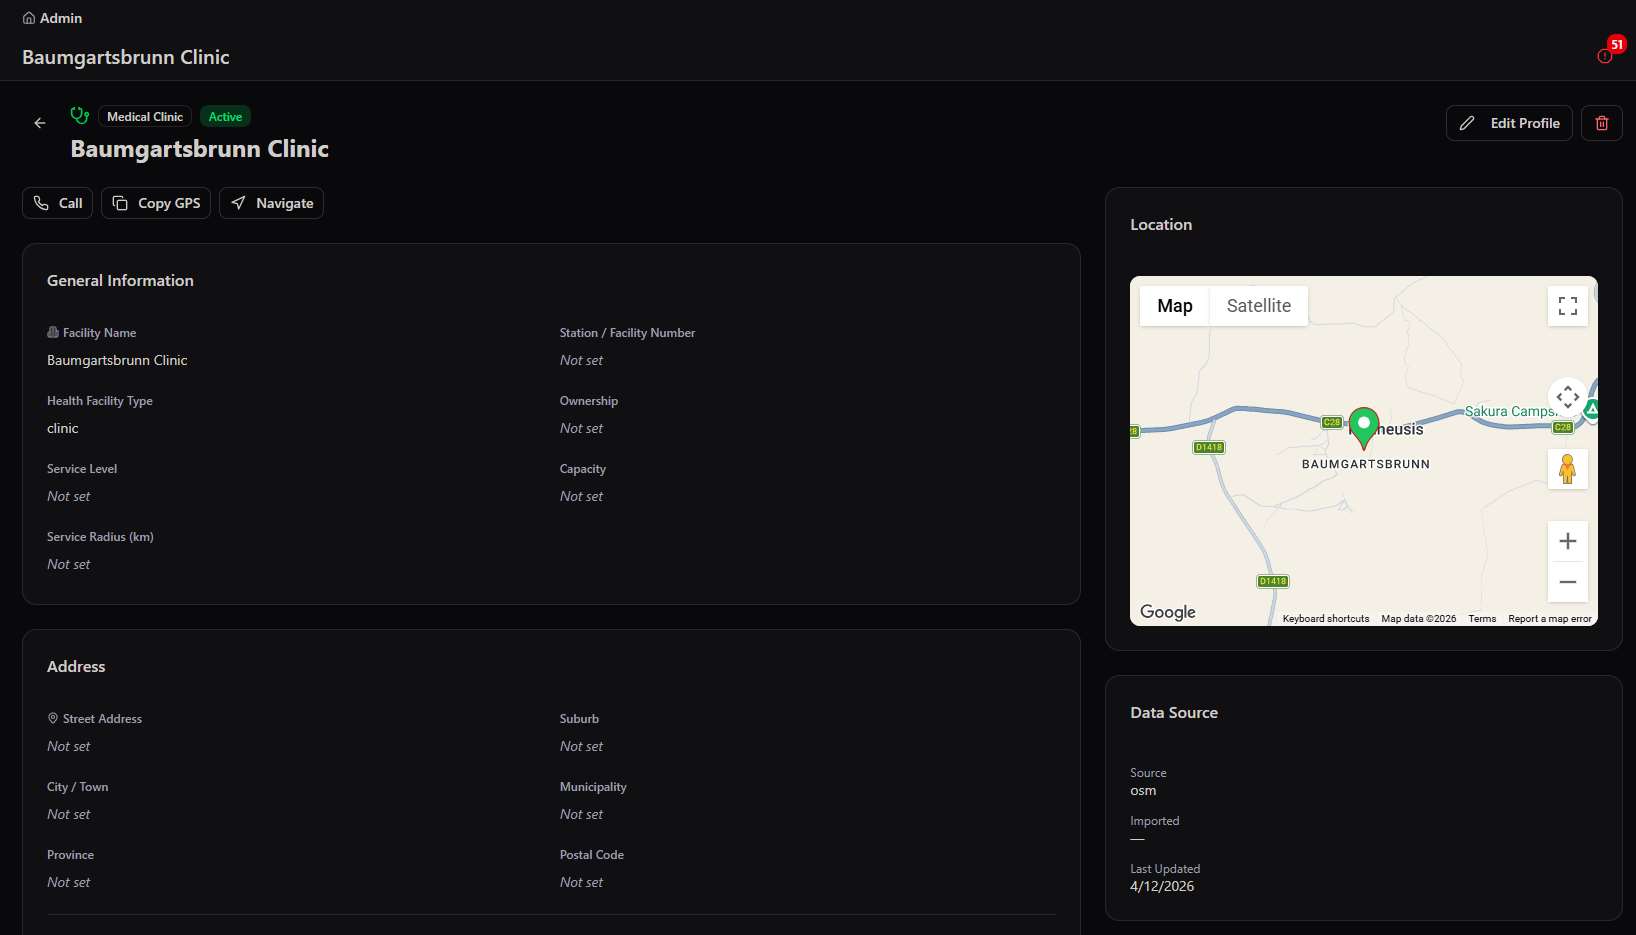
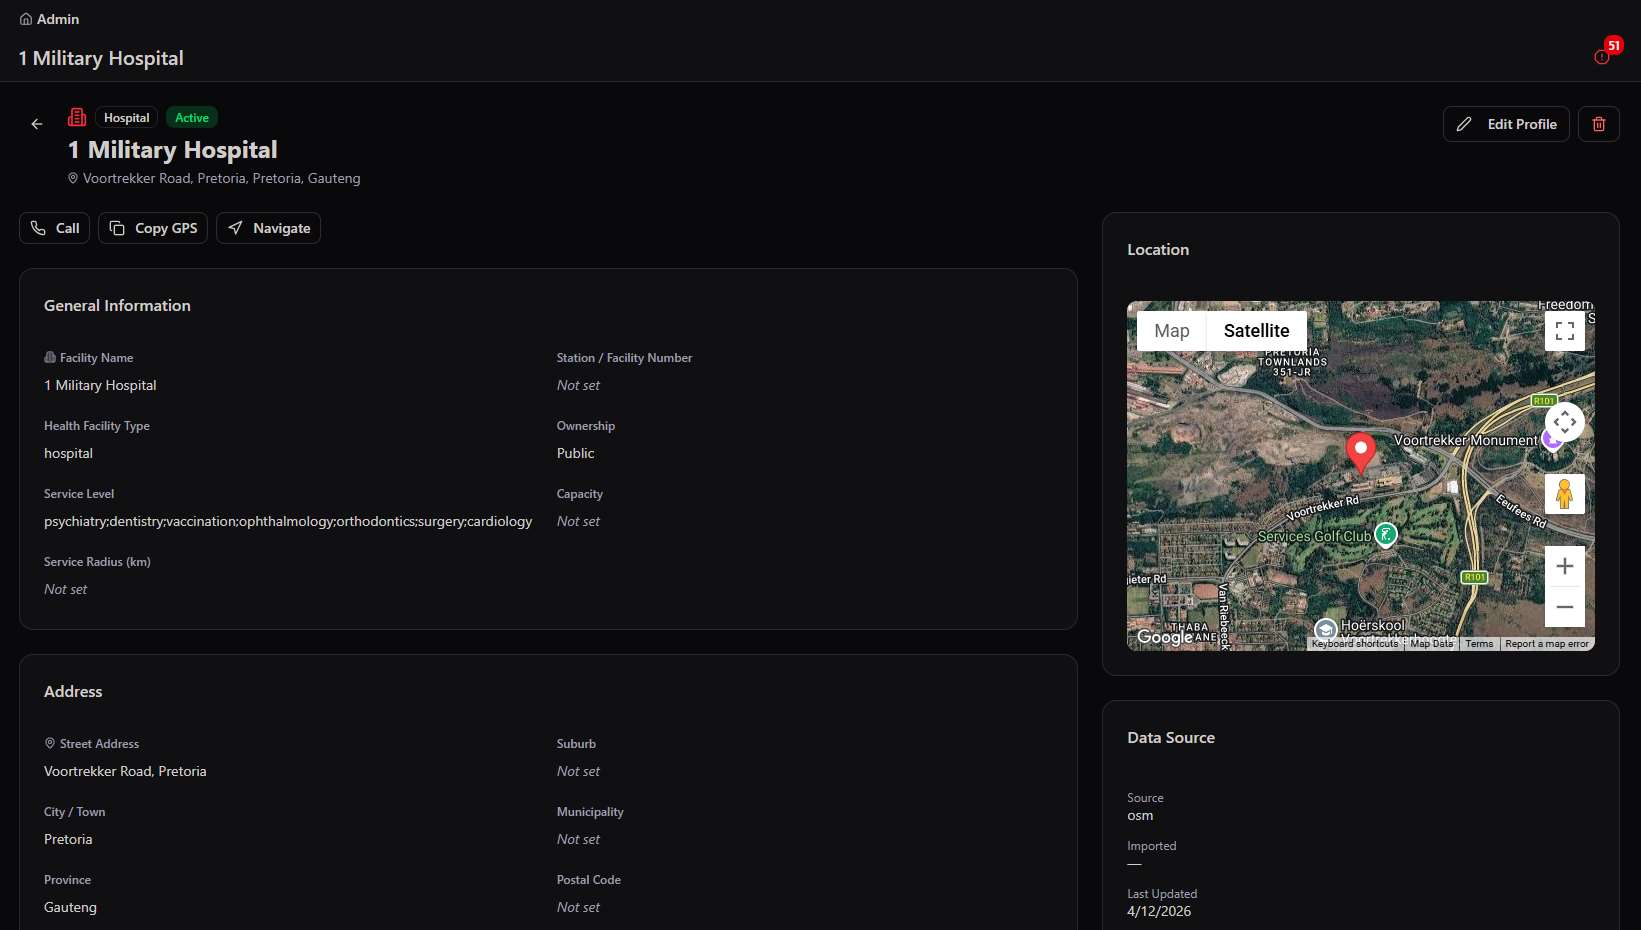
Every facility — police station, hospital, or clinic alike — opens into the same structured detail view: general information, full address, contact details, and a location map, with quick actions to call, copy GPS coordinates, or navigate.
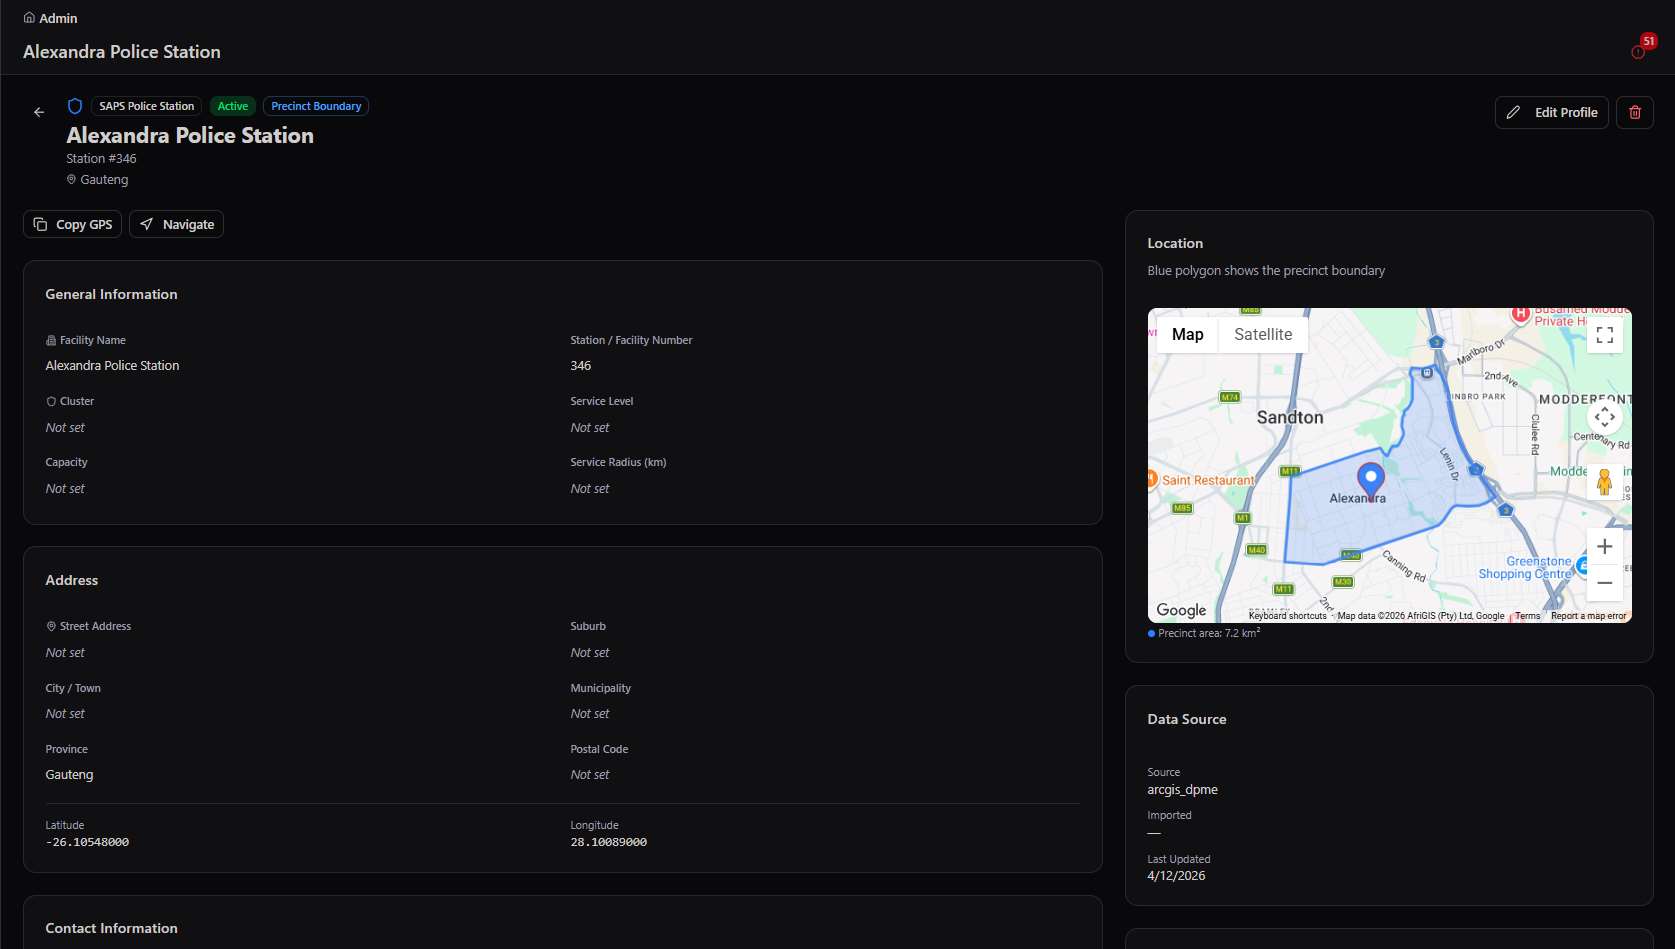
Alexandra Police Station detail record
Alexandra Police Station → SAPS facility record with location map and data source
1 Military Hospital detail record
1 Military Hospital → hospital record with service level and capacity fields
Baumgartsbrunn Clinic detail record
Baumgartsbrunn Clinic → the same structured record for a smaller community clinic
Facility Libraries filtered to clinics
Selecting a facility type stat card filters the entire list — here, clinics only
🚓
SAPS Police Stations
1,167 stations imported directly from SAPS boundary data, each with station number and jurisdiction.
🏥
Hospitals & Clinics
888 hospitals and 1,526 clinics, sourced from the Department of Planning, Monitoring & Evaluation, each classed by facility type and service level.
🚒
Fire Stations
195 fire stations catalogued alongside the rest of the emergency services network for complete regional coverage.
📍
Location & data source
Every facility carries a map location and its data source — confirming the record traces back to an authoritative import, not a manual guess.

Powers "nearest facility" everywhere. This is the same directory Event Processing draws on for its Nearest Emergency Facilities panel — one authoritative list of real hospitals, clinics, police, and fire stations feeding every module that needs to know what's nearby.

Module 03

Municipalities

Full municipal profiles — boundaries, departments, contacts, organograms, wards, and event routing — for 9 South African municipalities.

Municipalities is the most structurally complete registry in GeoSpatial. Each municipality carries its own multi-tab profile — boundary map, department directory, named contacts, an organisational chart, its constituent wards, and the routing rules that decide which department gets notified about which kind of event.
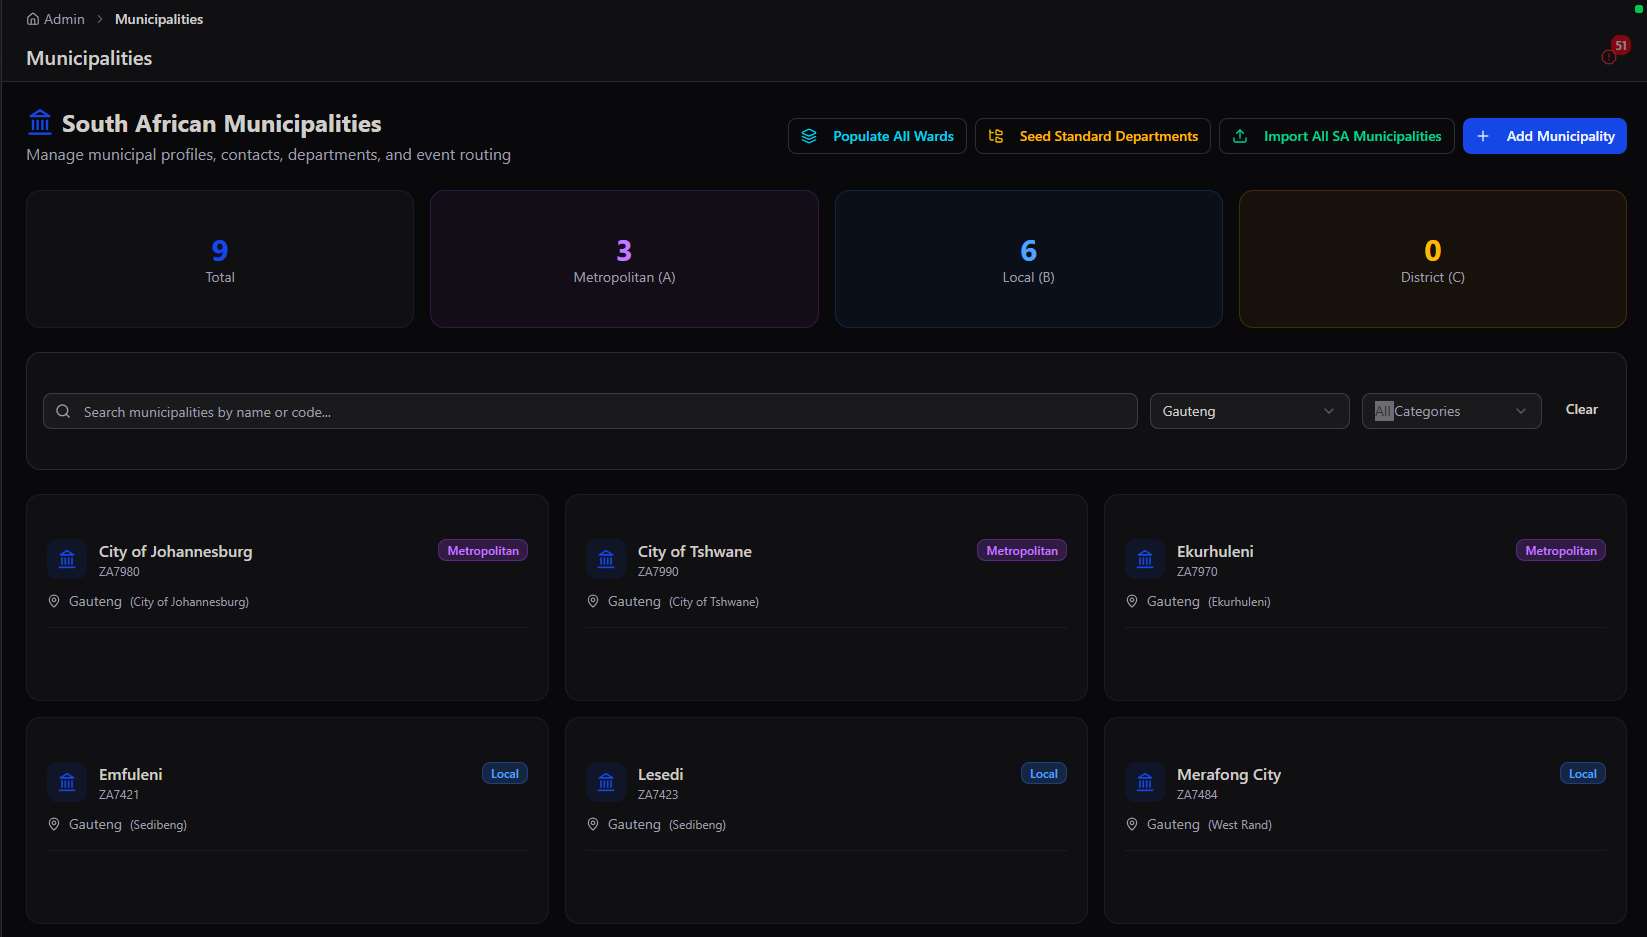
South African Municipalities list
Municipalities → 9 total (3 Metropolitan, 6 Local, 0 District), with bulk actions to populate wards or import all SA municipalities

A municipality's six tabs

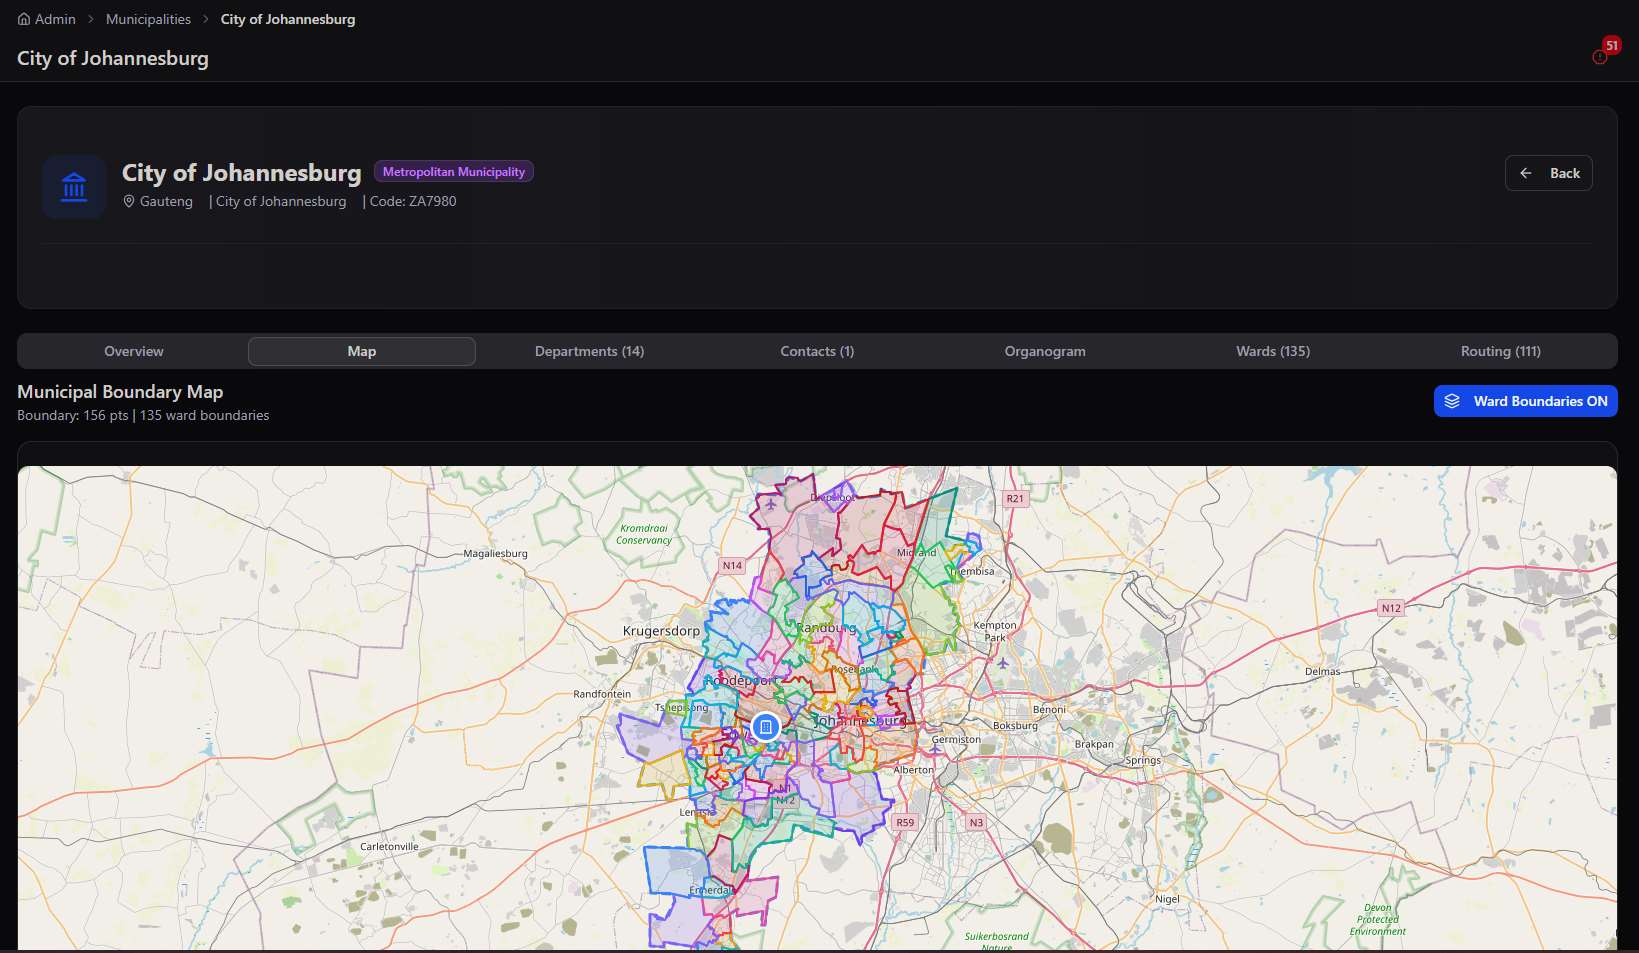
Opening any municipality — here, City of Johannesburg — surfaces a consistent structure regardless of size or type.
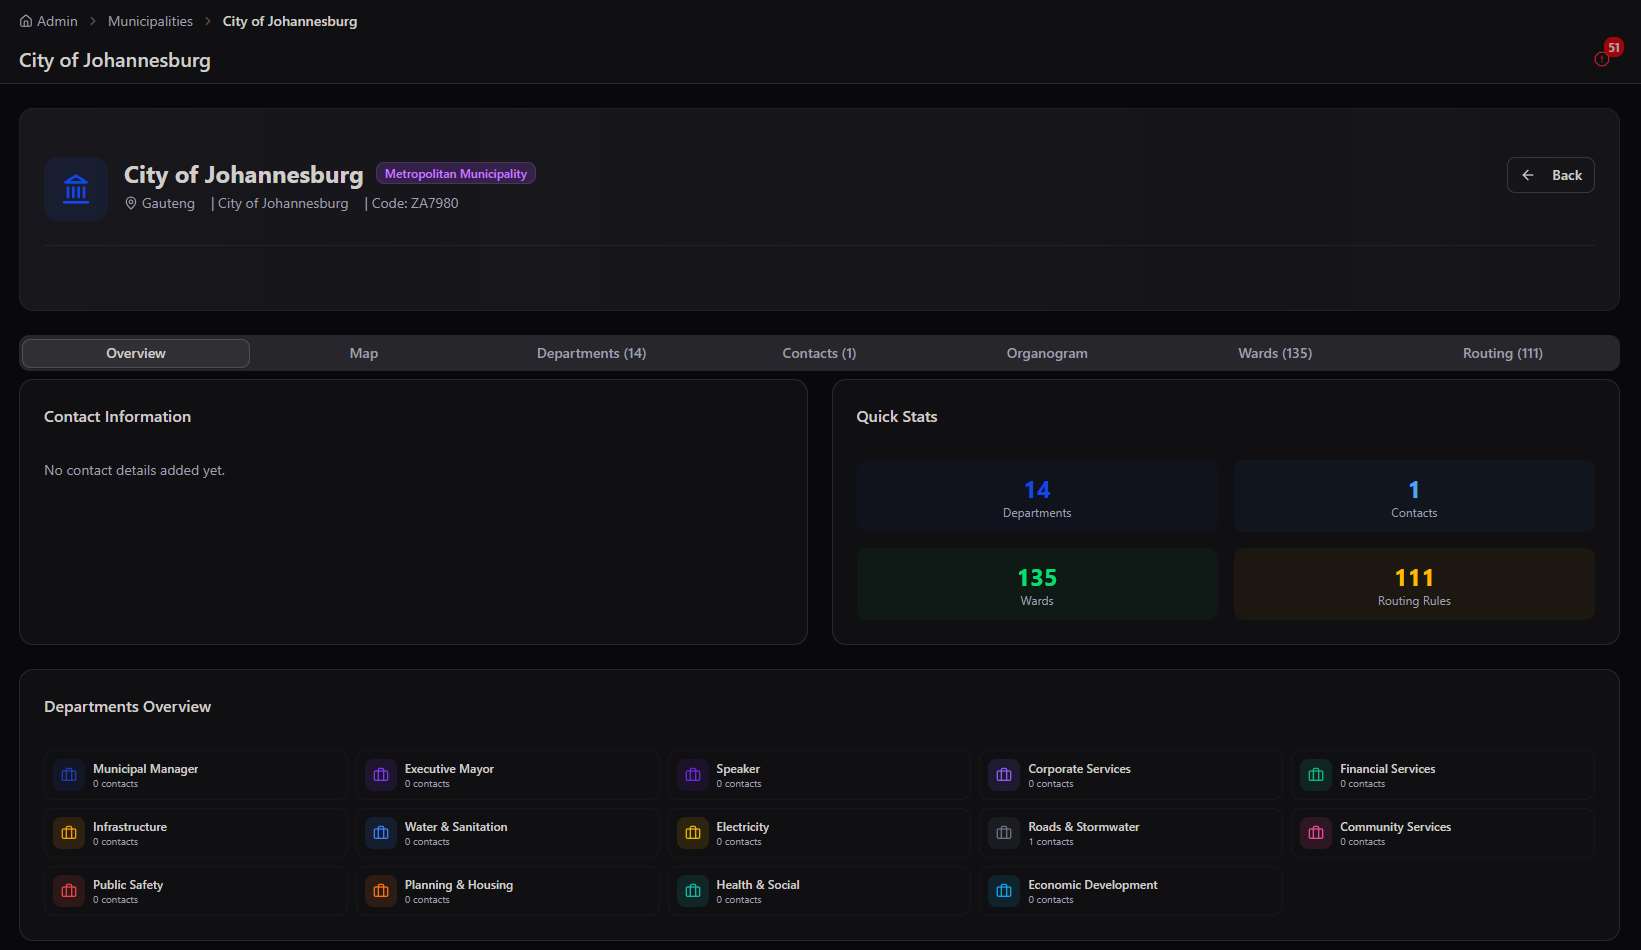
Municipality Overview tab
Overview → contact information, quick stats (departments, contacts, wards, routing rules), and a departments summary grid
Municipality Map tab
Map → the full municipal boundary with all 135 ward boundaries overlaid and toggleable
Municipality Departments tab
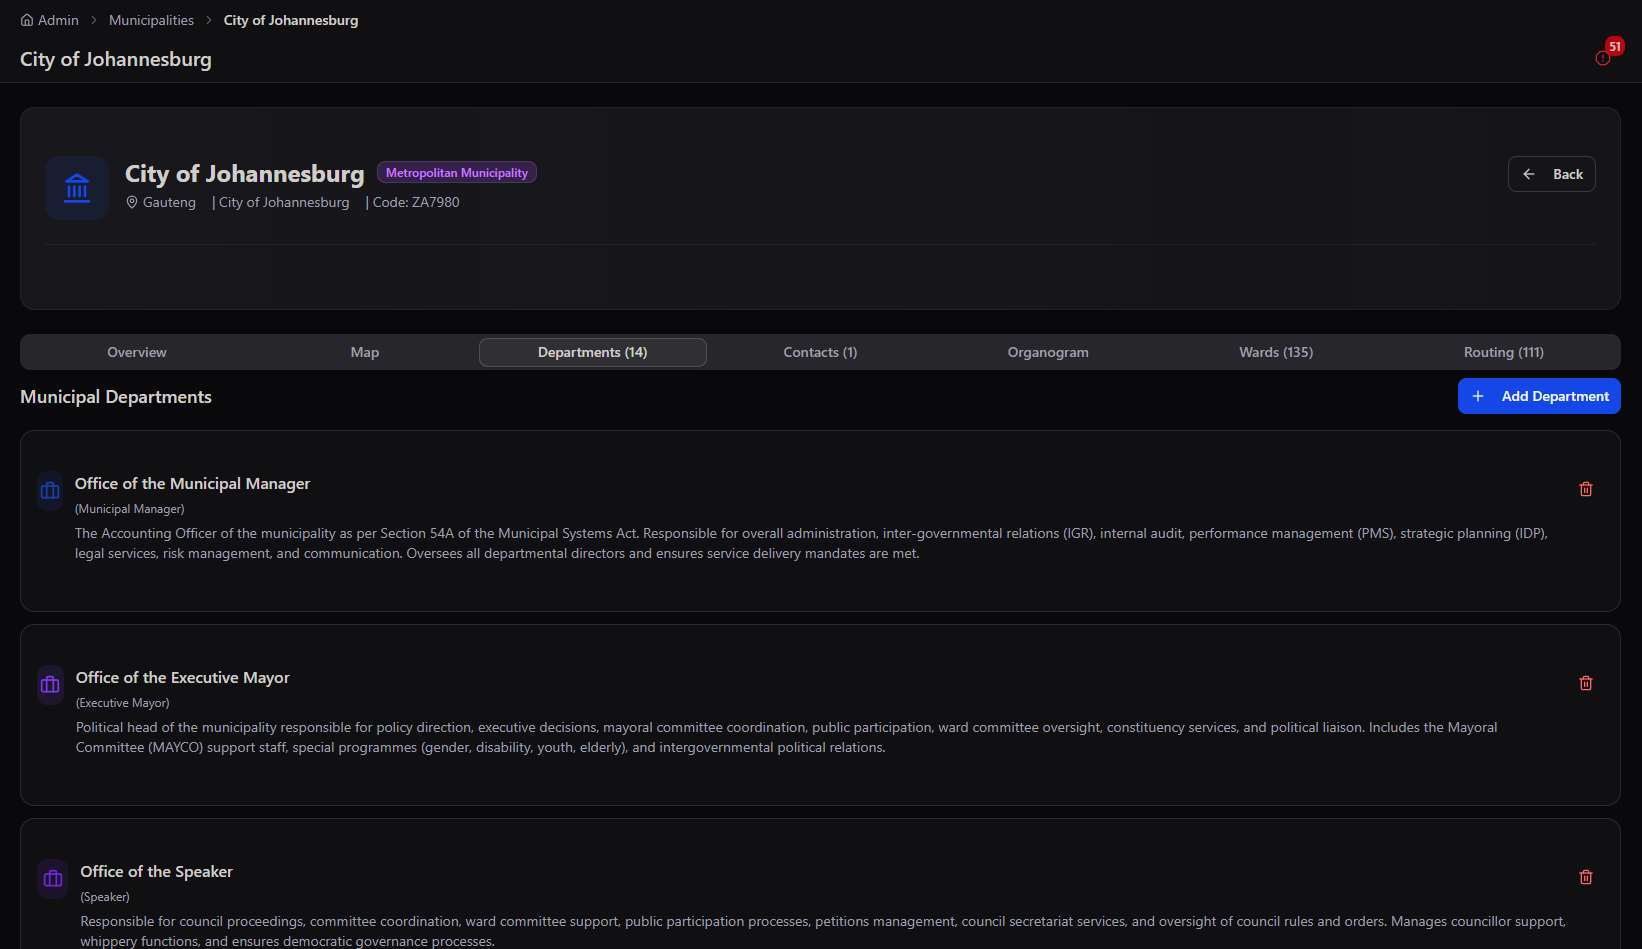
Departments → the full department directory (Municipal Manager, Executive Mayor, Speaker, and more), each with its function described
Municipality Contacts tab
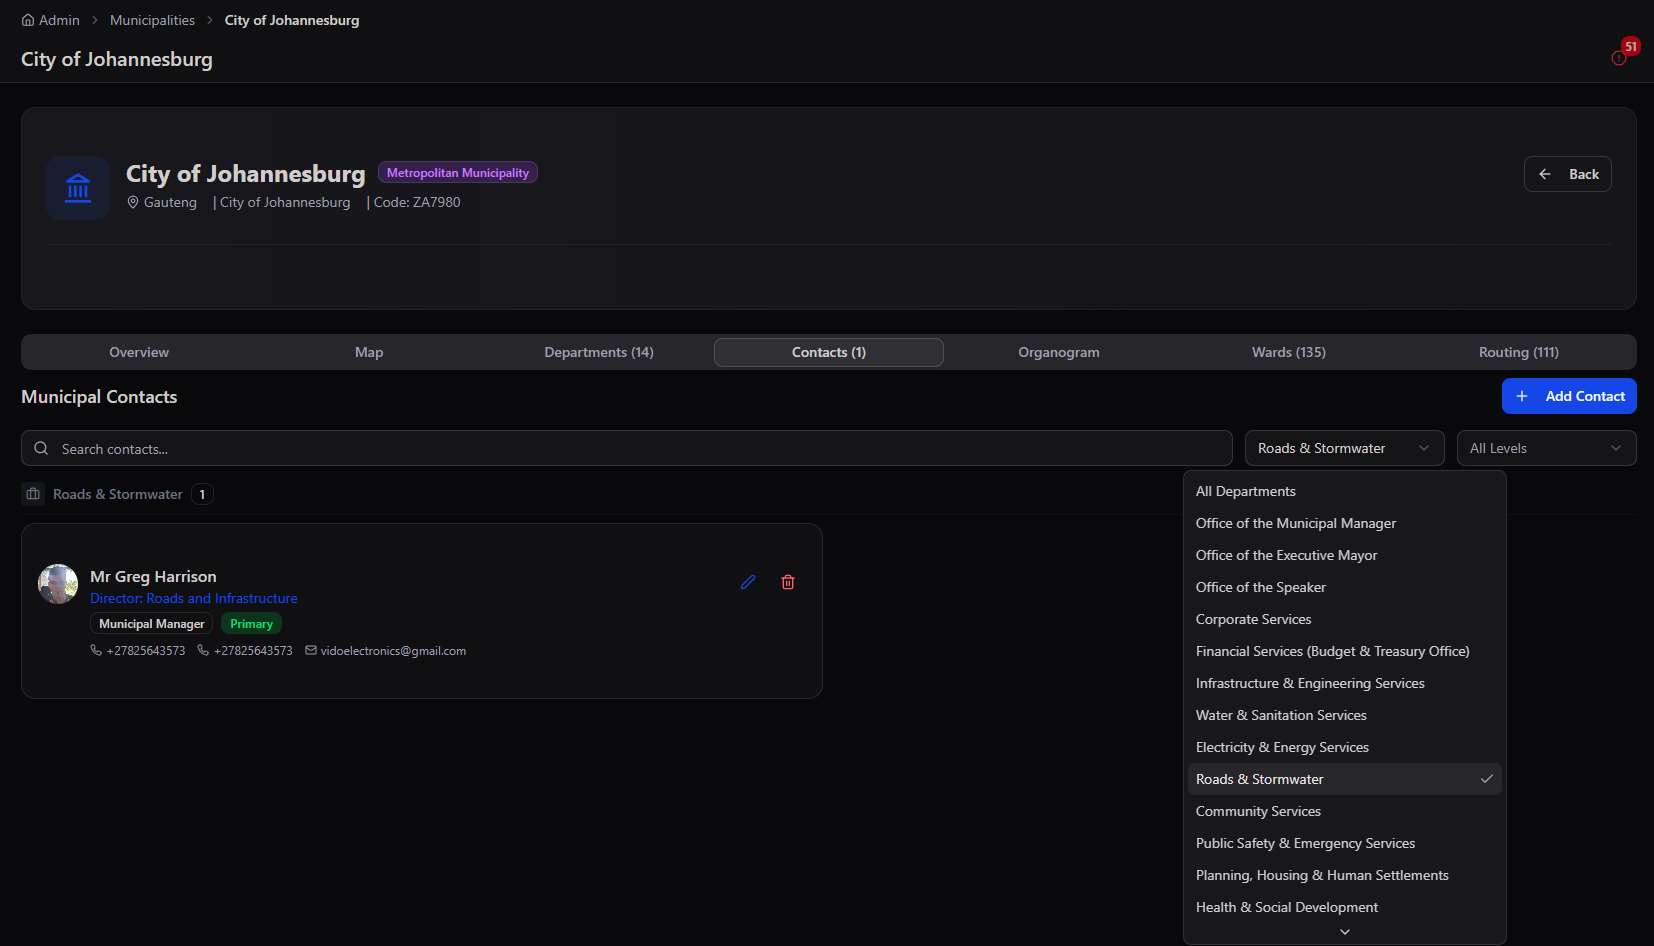
Contacts → named individuals per department, filterable by department and level, ready to Add Contact
Municipality Organogram tab
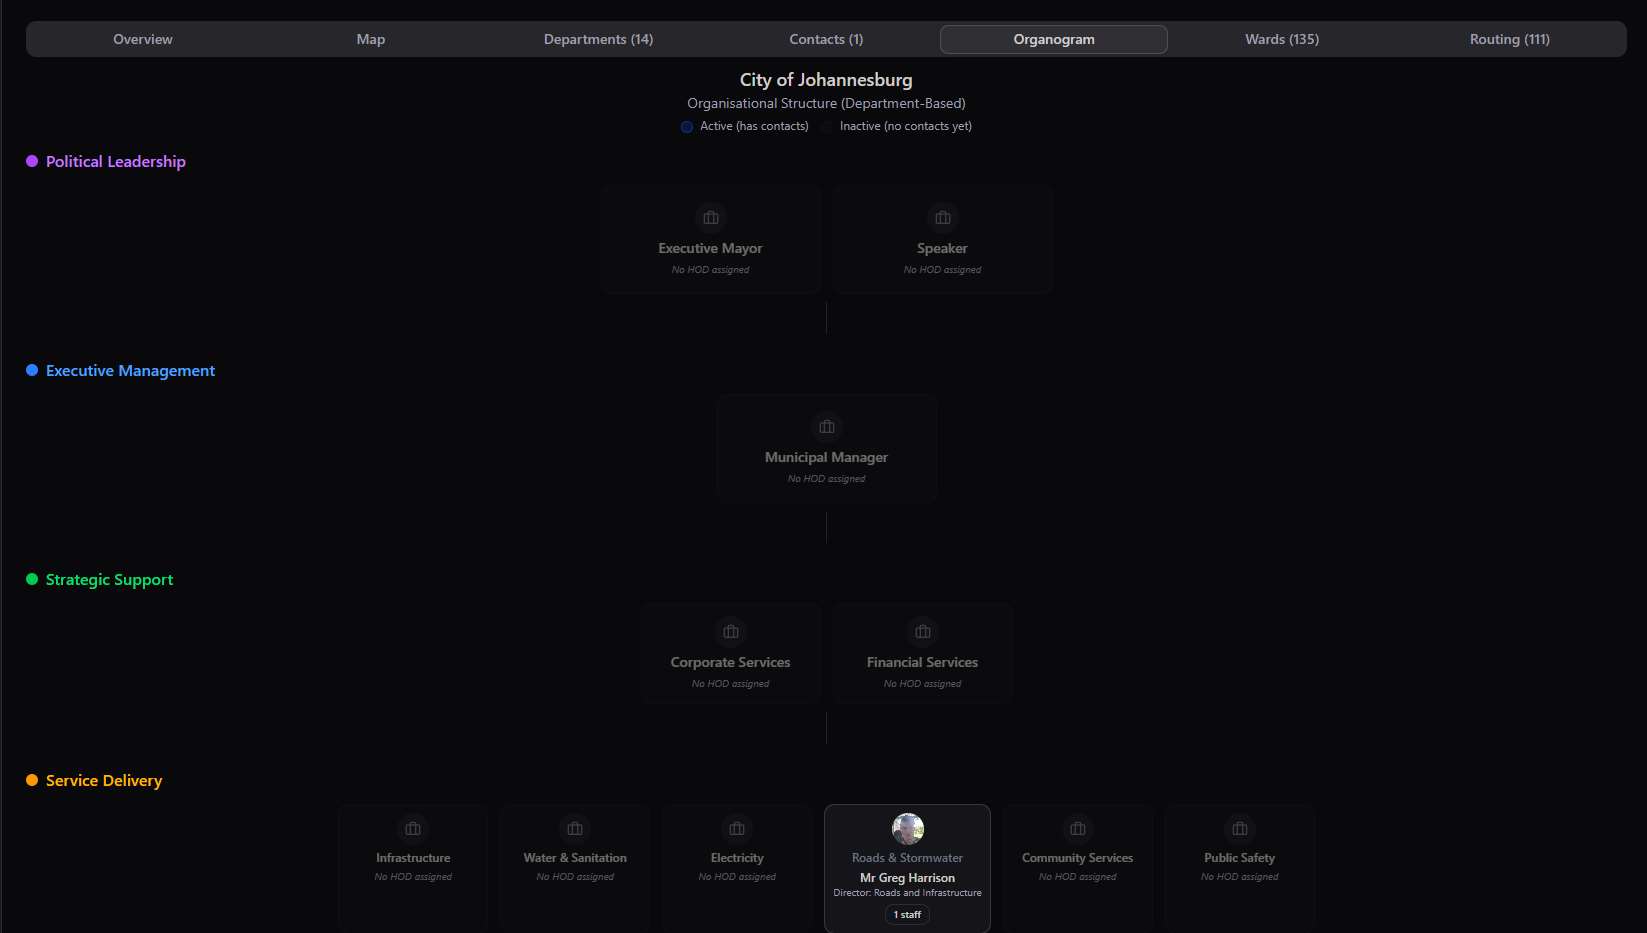
Organogram → the full leadership structure from Political Leadership down to Service Delivery departments
Municipality Wards tab
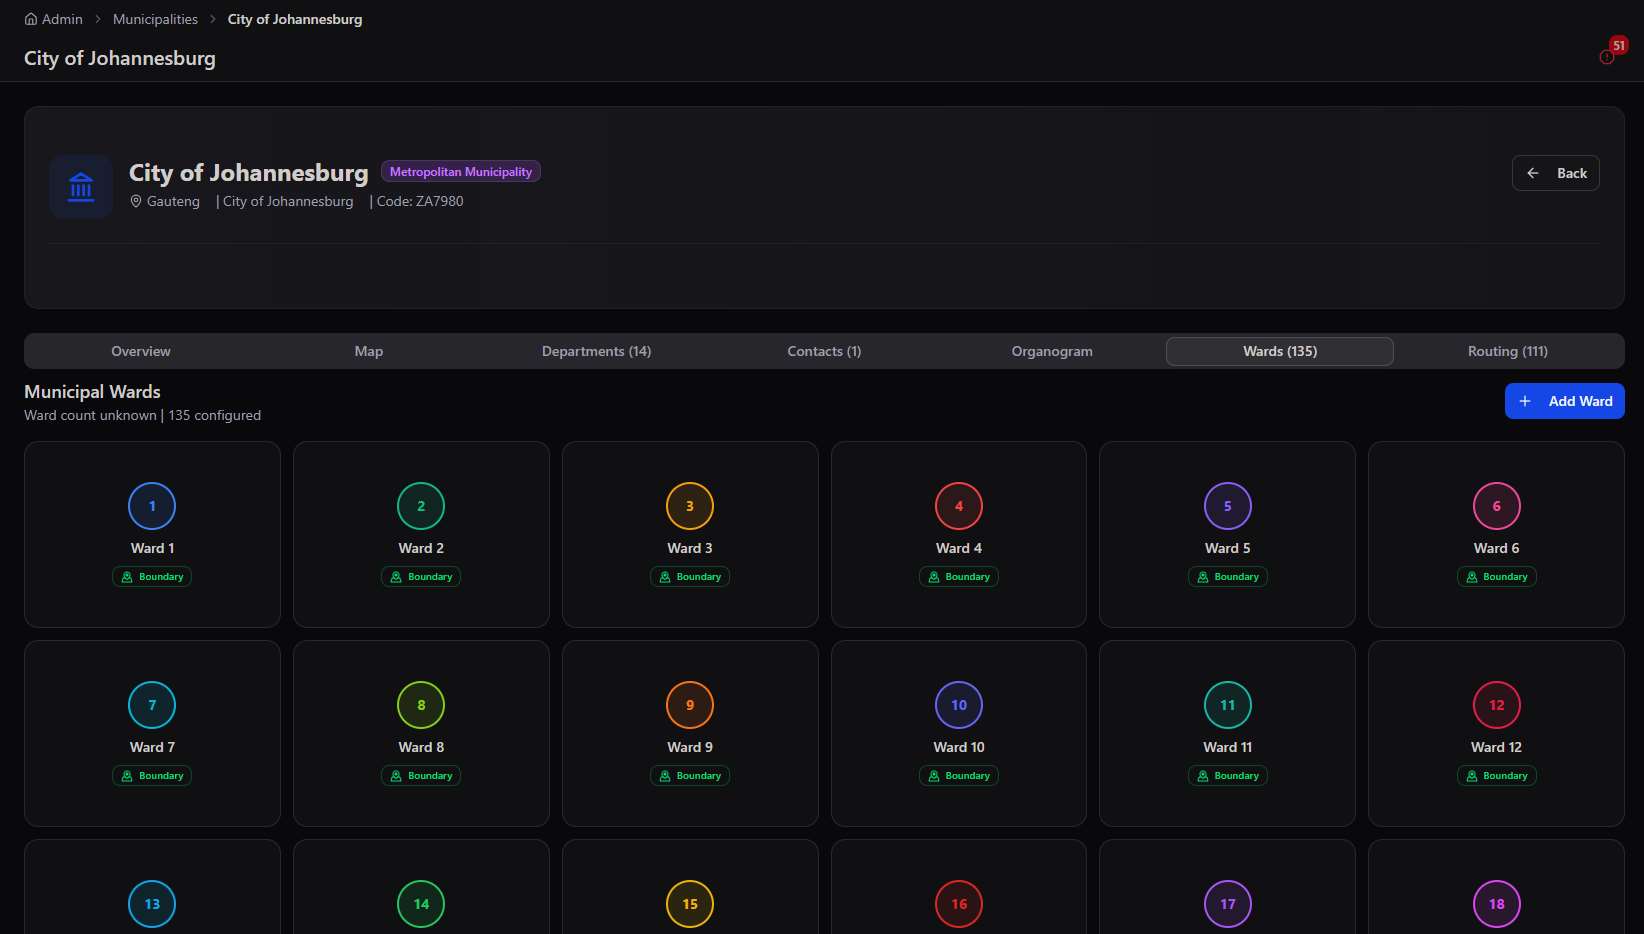
Wards → all 135 wards for this municipality, each showing its boundary status at a glance
Municipality Routing tab showing event routing rules
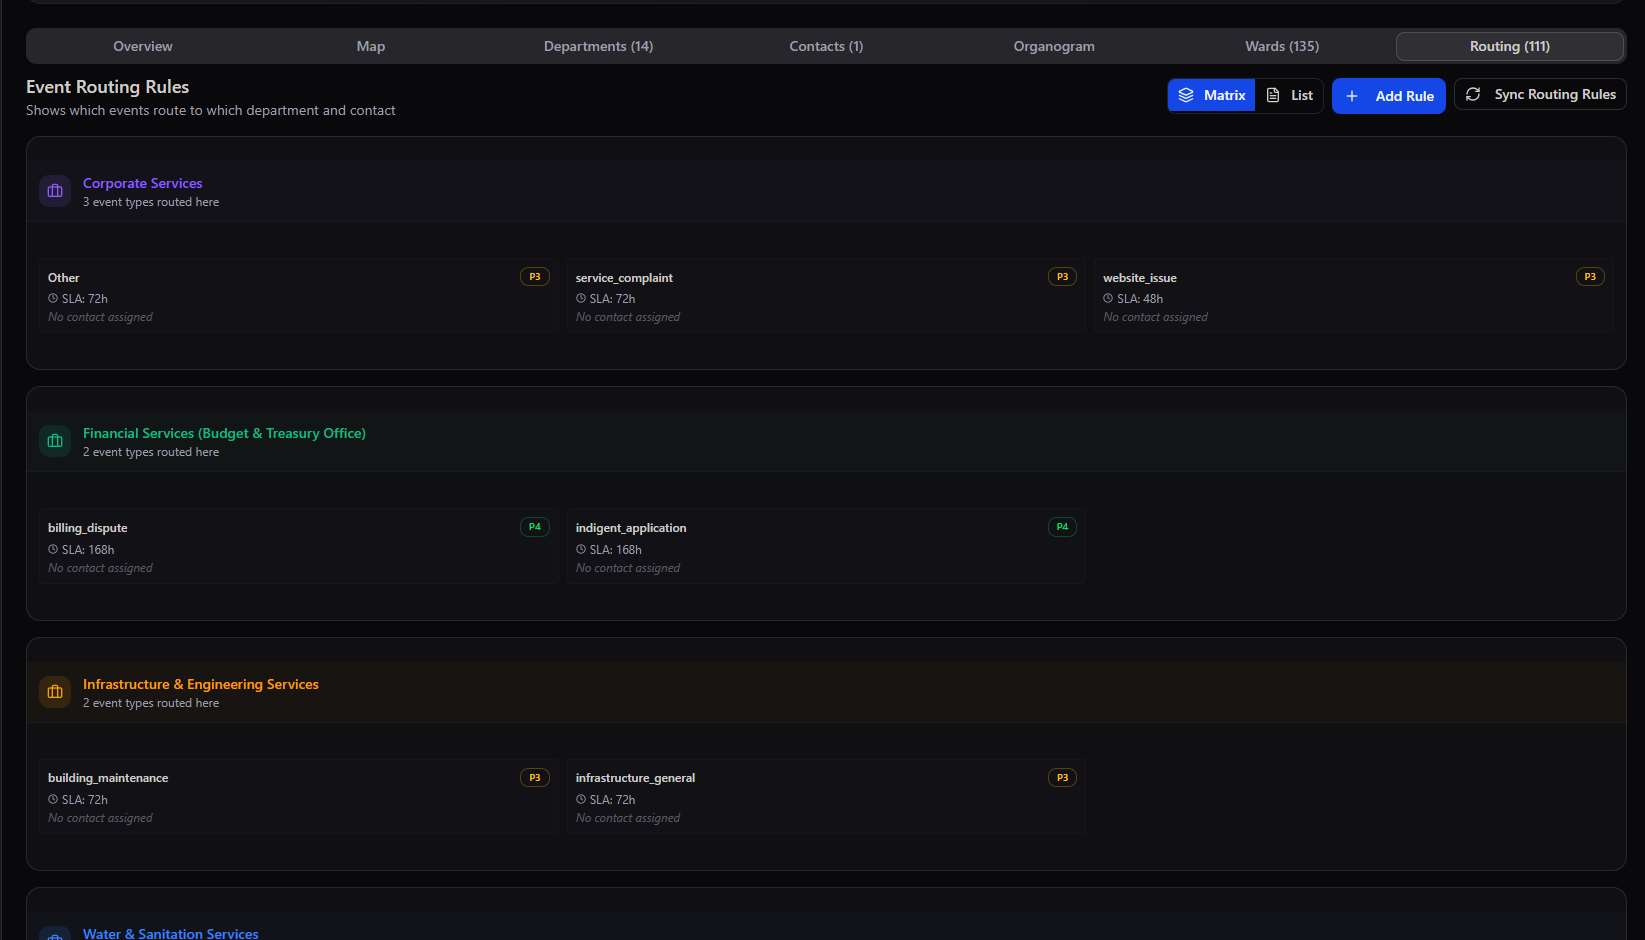
Routing → event routing rules mapping event types (billing disputes, water leaks, infrastructure faults) to the correct department and contact, with SLA times
Add Department modal
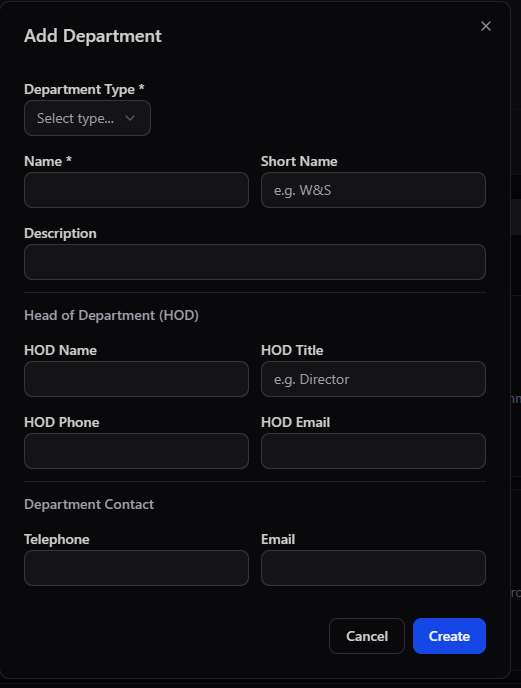
Add Department → register a new department with its type, HOD details, and departmental contact information

Municipality types

🏙️ Metropolitan
Major metro-level municipalities — 3 configured
🏘️ Local
Local municipalities within a district — 6 configured
🌍 District
District-level municipalities — available, none configured yet

Routing turns a report into an action. When a citizen logs a water leak or a billing dispute, the Routing tab's rules are what decide which municipal department — and which named contact — actually receives it, with an SLA clock attached from the moment it's routed.

Module 04

Geofence Zones

Custom monitoring zones with entry and exit alerts — independent of Communities and Fixed Targets, for any boundary you need to watch.

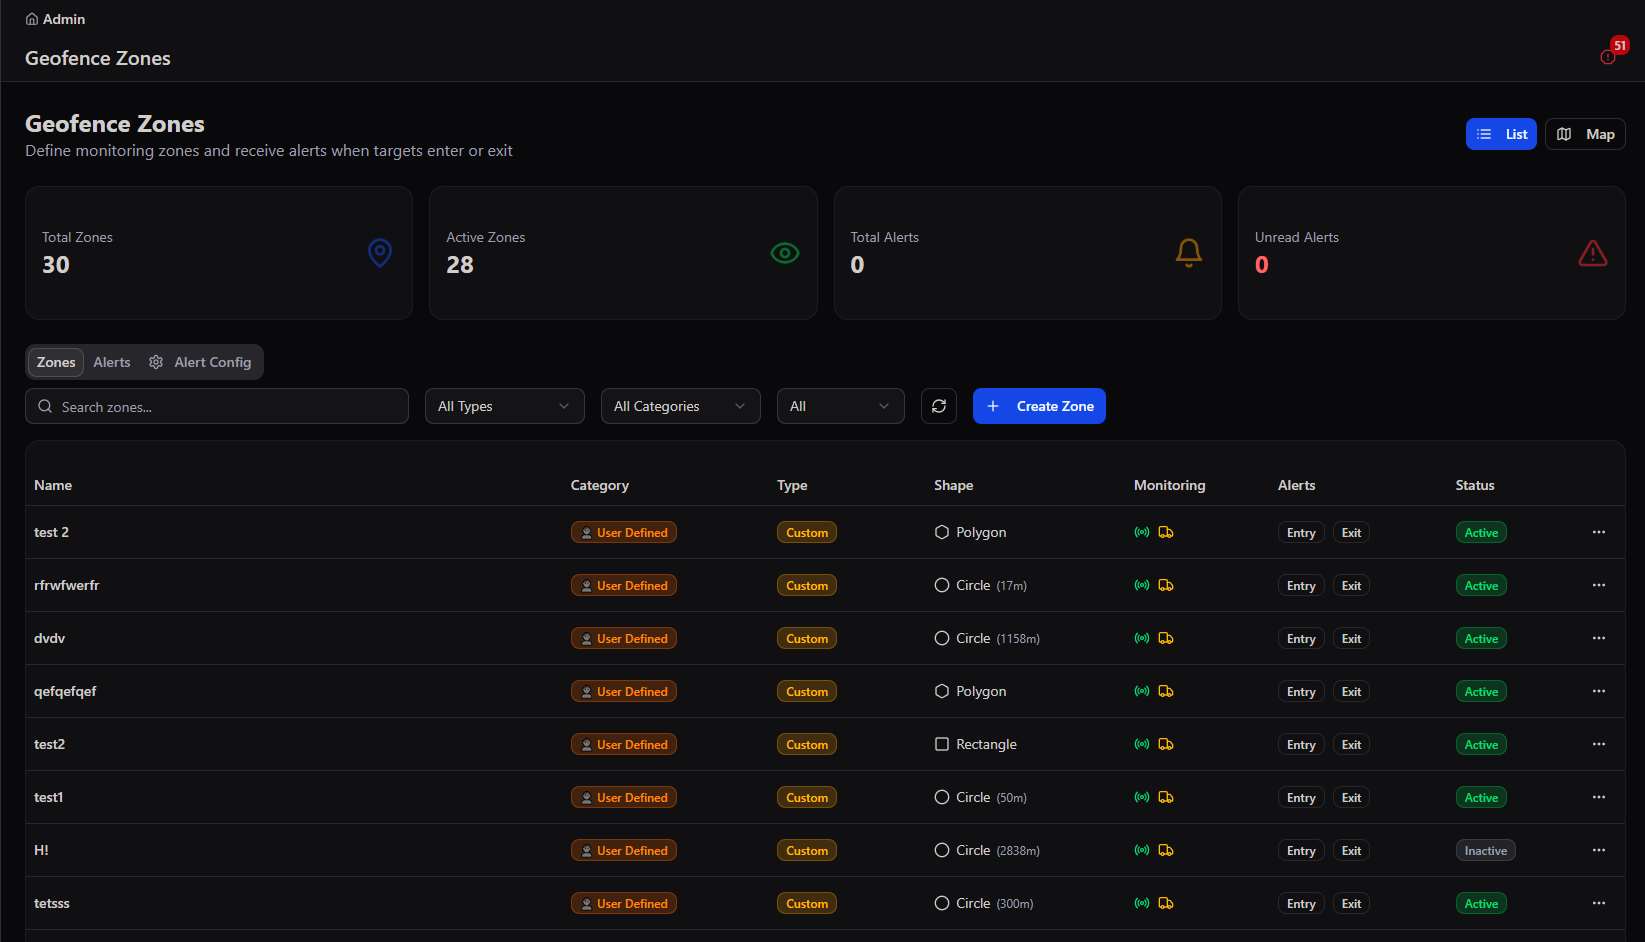
Where Communities and Fixed Targets carry their own built-in geofences, Geofence Zones lets an admin define any additional monitoring boundary — a restricted area, a high-risk corridor, a custom surveillance zone — and choose exactly who triggers an alert by entering or exiting it.
Geofence Zones list view
Geofence Zones → 30 total zones, 28 active, with shape, monitoring targets, alert configuration, and status per zone
Geofence Zones map view
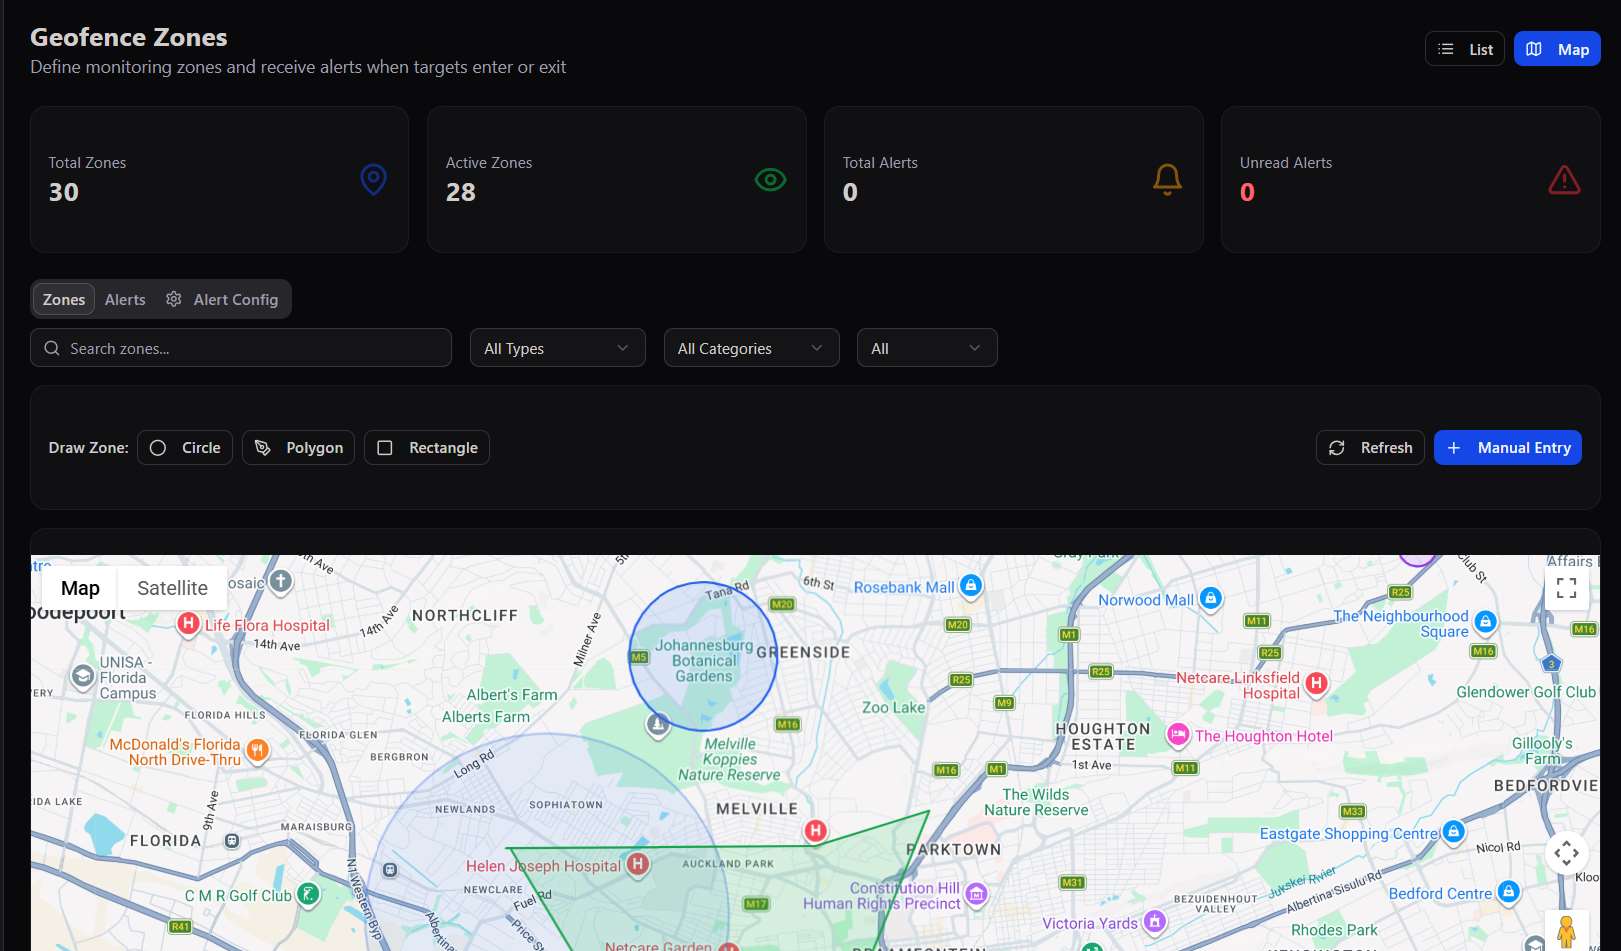
Map view → every zone plotted on the live map, with drawing tools for Circle, Polygon, and Rectangle shapes

Creating a zone

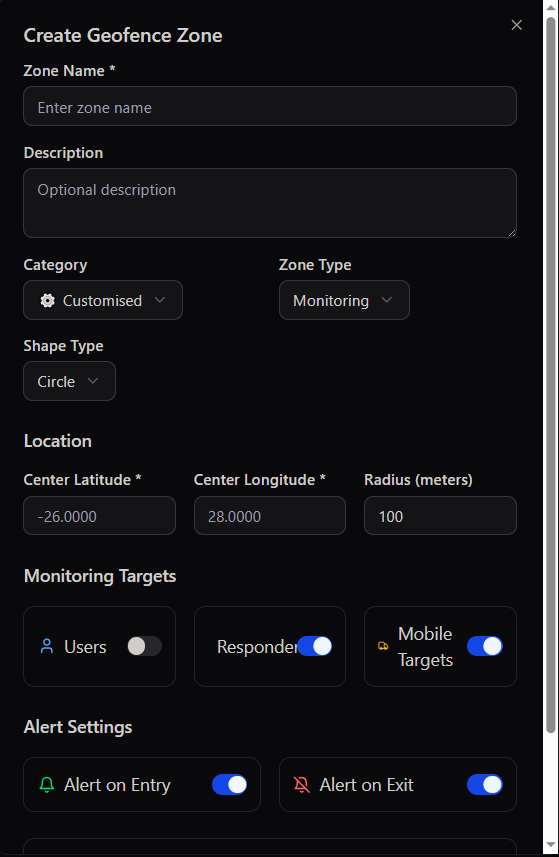
Naming, categorising, and shaping a zone takes one form — choose a shape type, set its location and radius (or draw it directly), decide which monitoring targets it applies to, and configure entry and exit alerts.
Create Geofence Zone modal
Create Geofence Zone → name, category, shape type, centre coordinates and radius, monitoring targets, and alert toggles
Geofence Alert Configuration tab
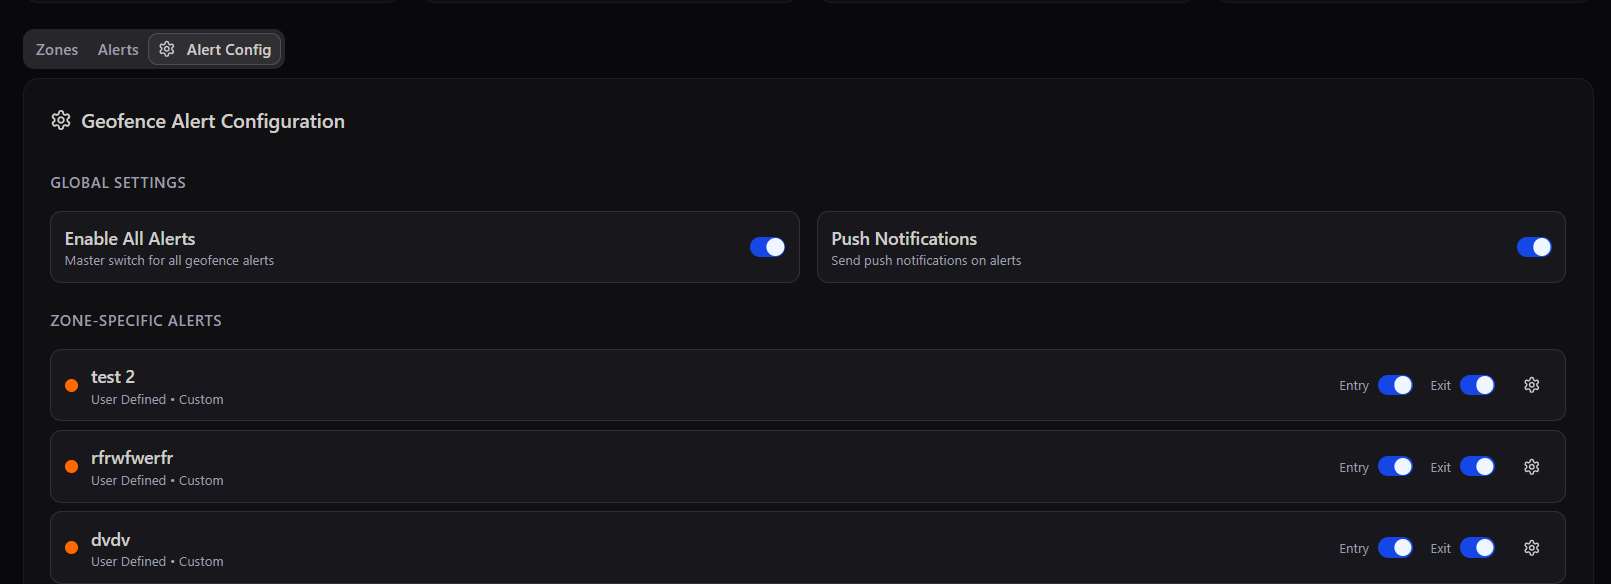
Alert Config → global switches for all alerts and push notifications, plus per-zone entry/exit alert toggles
Three shape types
Draw a zone as a Circle (centre + radius), a Polygon (custom outline), or a Rectangle — whichever best matches the real boundary.
🎯
Monitoring targets
Choose whether a zone watches Users, Responders, Mobile Targets, or any combination — the same entities tracked everywhere else on the platform.
🔔
Entry & exit alerts
Configure independent alerts for when a monitored target enters a zone versus when it exits — critical for both restricted-area breaches and safe-zone departures.
🗂️
Category & custom labelling
Tag each zone by category so it's filterable alongside dozens of others, keeping a large zone library organised as it grows.
30
Total geofence zones defined
28
Currently active zones
2
Alert directions — entry and exit — per zone

General-purpose, beyond communities. A logistics company can draw a geofence around a warehouse yard to alert on unauthorised vehicle movement; a security company can ring a high-risk intersection to flag when a responder enters it. Geofence Zones exists for exactly the boundaries that don't map neatly onto a Community or a Fixed Target.

Complete platform. Every place, understood.

GeoSpatial — across Ward Library, Facility Libraries, Municipalities, and Geofence Zones — is the geographic layer every other module quietly depends on. The underlying question it answers is simple: where exactly are we, what governs this place, what's nearby, and what boundaries matter here? Event Processing, Targets, and Responder Management all draw their geographic intelligence from this single, authoritative source.